
To open long positions on EURUSD, you need:
In my morning forecast, I paid attention to the 1.1575 level and recommended making decisions on entering the market from it. Let's look at the 5-minute chart and figure out the entry point. Even good data on the growth of the eurozone investor confidence indicator did not allow the bulls to break above 1.1575, and after several unsuccessful attempts to go beyond this range, a sell signal was formed for the euro. The downward movement was about 15 points, after which the bulls returned to the assault of 1.1571. The volatility in the market is quite low, which is quite expected at the beginning of this week. From a technical point of view, nothing has changed.
The bulls will also count on an upward correction of the pair and statements by representatives of the Federal Reserve System, which may lead to a breakout of the 1.1575 resistance. Only going beyond this level with a reverse test from top to bottom will give an entry point into long positions with the aim of EUR/USD growth to the area of 1.1595, where I recommend fixing the profits. The breakthrough of this range will depend entirely on the speeches of the heads of the European Central Bank and the Federal Reserve System since the publication of fundamental statistics is not scheduled for the afternoon. The 1.1595 test from top to bottom will lead to an additional buy signal and a return of EUR/USD to the upper boundary of the wide side channel 1.1615. In case of a return of pressure on the pair, only the formation of a false breakdown in the area of 1.1549, where the moving averages are already playing on the buyers' side, will give an excellent signal to buy the euro with the aim of an upward correction. In the absence of an activity scenario at 1.1549, it is best to wait for the formation of a false breakdown in the area of 1.1527, but you can open long positions in EUR/USD immediately to rebound from the minimum of 1.1494, or even lower - from 1.1454, counting on a correction of 15-20 points within the day.
To open short positions on EURUSD, you need:
Sellers showed themselves again in the area of 1.1571. Now, this level has been transformed to 1.1575, and the bears need to think carefully about protecting this range. Only hawkish statements by representatives of the Federal Reserve System on the topic of monetary policy, as well as the next formation of a false breakdown at 1.1575, will lead to the formation of a signal to sell the euro to reduce to the intermediate support of 1.1549. We didn't reach it quite a bit in the first half of the day. A tough fight is unlikely to unfold for this level, so its breakthrough and update from the bottom up form an additional signal to open new short positions, followed by a fall of the pair to the area of 1.1527. A breakdown of this range will also lead to the demolition of buyers' stop orders, which will quickly dump EUR/USD to 1.1494, where I recommend fixing the profits. A more distant target will be the support of 1.1454. In the scenario of the pair's growth in the afternoon and the absence of sellers at the level of 1.1575, it is best to postpone sales until the test of the maximum of 1.1595. It is possible to open short positions immediately for a rebound based on a downward correction of 15-20 points from a large resistance of 1.1615.
The COT report (Commitment of Traders) for October 19 recorded a reduction in both short and long positions, which led to a slight recovery of the negative delta, as more sellers left the market than buyers. The slowdown in activity in the manufacturing and services sectors of the eurozone this week will not allow euro buyers to get beyond the 16th figure. However, the key problem in the shorter term, which harms the growth of the euro, is the sharp spread of the fourth wave of coronavirus infection throughout the European Union. As for the United States of America, the good pace of activity of the American economy and the expected reduction of the economic support program will not create serious problems for economic growth in the future. However, this will not help the US dollar much, as investors will prefer risky assets. The COT report indicates that long non-commercial positions decreased from the level of 202,512 to the level of 193,320, while short non-commercial positions dropped from the level of 220,910 to the level of 205,427. At the end of the week, the total non-commercial net position decreased and amounted to -12,107 against -18,398. The weekly closing price rose to the level of 1.1613 against 1.1553.
Indicator signals:
Moving Averages
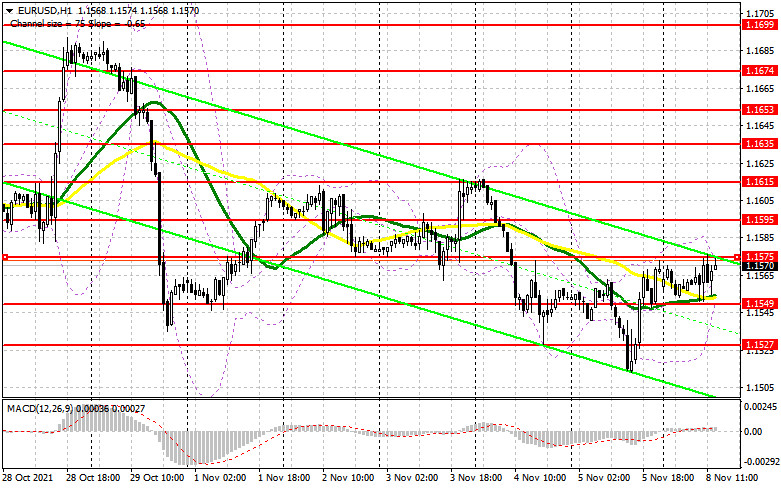
Trading is conducted above 30 and 50 daily moving averages, which indicates an attempt by the bulls to build an upward correction.
Note: The period and prices of moving averages are considered by the author on the hourly chart H1 and differ from the general definition of the classic daily moving averages on the daily chart D1.
Bollinger Bands
A breakthrough of the lower limit of the indicator in the area of 1.1549 will lead to an instant fall of the euro. A break of the upper limit in the area of 1.1575 will lead to new growth of the pair.
Description of indicators
- Moving average (moving average determines the current trend by smoothing out volatility and noise). Period 50. The graph is marked in yellow.
- Moving average (moving average determines the current trend by smoothing out volatility and noise). Period 30. The graph is marked in green.
- MACD indicator (Moving Average Convergence / Divergence - moving average convergence/divergence) Fast EMA period 12. Slow EMA period 26. SMA period 9
- Bollinger Bands (Bollinger Bands). Period 20
- Non-profit speculative traders, such as individual traders, hedge funds, and large institutions that use the futures market for speculative purposes and meet certain requirements.
- Long non-commercial positions represent the total long open position of non-commercial traders.
- Short non-commercial positions represent the total short open position of non-commercial traders.
- Total non-commercial net position is the difference between the short and long positions of non-commercial traders.