
4 hour time-frame
Amplitude of the last 5 days (high-low): 75p - 51p - 93p - 35p - 46p.
Average volatility over the past 5 days: 60p (average).
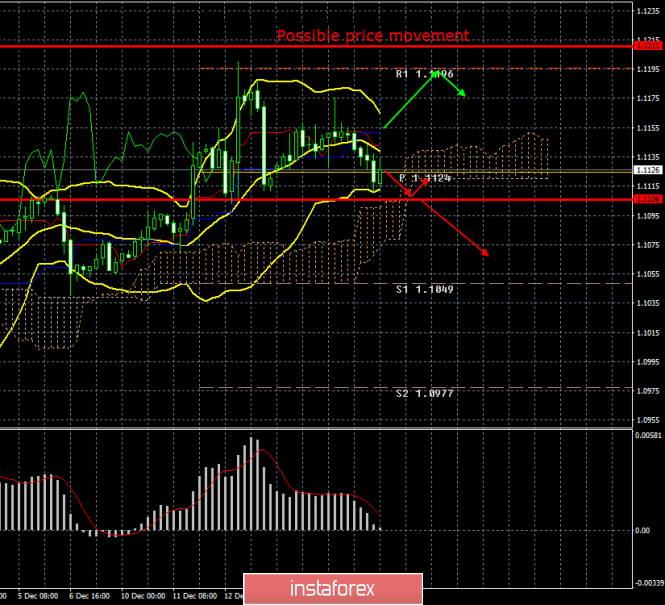
On Wednesday, December 18, the EUR/USD currency pair continued its downward corrective movement, broken through the Kijun-sen critical line and came close to the volatility level of 1.1106, which we call the minimum price level for today. At the same time, the price continues to be located above the Ichimoku cloud, but the Tenkan-sen and Kijun-sen lines crossed, which means the formation of a new "dead cross" sell signal. Based on this, we received the first signs of the emergence of a new downward trend, which is still fully justified from a fundamental point of view - both short-term and long-term. During the third trading day of the week in Germany, a producer price index was published, which predicts the future level of inflation. After all, if, for example, producer prices fall or their growth rates decline, then roughly the same can be expected from inflation in the country. So producer prices in monthly terms showed a zero increase in November, and they decline by 0.7% compared to November last year. Thus, we consider this index value a harbinger of sheer disaster. On the other hand, inflation in Germany may continue to slow down, although a recent report showed no change and a value of + 1.1% y / y. However, a reduction in producer prices can only mean a further slowdown in general inflation in Germany. If we recall that inflation in Italy is approaching a zero value in annual terms, then it becomes scary for pan-European inflation, and the probability of lowering the key rates of the ECB increases many times.
Today, inflation was published in the European Union, which has not yet had time to react to a slowdown in inflation in individual countries of the eurozone and a negative producer price index in Germany. According to the statistics office, the consumer price index amounted to 1.0% y / y in November, which fully coincides with the forecast values. In monthly terms, a 0.3% decline in prices followed. We expected that inflation would not keep the level of 1.0%, which, in principle, is already quite low and far from the inflation target set by the ECB (2.0% y / y). The more likely it is that next month, the slowdown in inflation in the European Union will resume. In addition, eurocurrency showed a moderate decline today and we believe that the decline will continue in almost any case. We have repeatedly written about the sharply negative fundamental background for the Euro currency, Now, trend indicators are starting to unfold in favor of the US dollar. If traders manage to overcome the Ichimoku cloud, the probability of a new downward trend will increase significantly.
Well, the bulls can only wait for negative news from the United States, hoping that they will be very bad so that economic data from the European Union look more "worthy" against their background. However, we do not expect a sharp deterioration in macroeconomic statistics in the United States in the near future. Although it is likely that it will continue to deteriorate in the EU. At the same time, rumors have been circulating for several months now that the measures taken by the ECB under the leadership of Mario Draghi at its penultimate meeting are clearly not enough to support the European economy. Perhaps, some positive changes will follow a little later, after all, China and the States have agreed on the "first phase" of the trade agreement, but we believe that this will not help the European currency and the Alliance economy too much. Thus, we quite reasonably expect further easing of the ECB's monetary policy, which is already ultra-soft. Christine Lagarde and the company simply have no choice.
Meanwhile, traders can make sure that there are a lot of "sharp corners" in relations between China and the United States once again. Today, Foreign Ministry spokesman Geng Shuang said that Washington's desire to limit the export of high technology to the PRC could negatively affect cooperation between American and Chinese companies. "China strongly opposes the US abusing the concept of national security and export controls. This interferes with normal cooperation between enterprises and countries." said Geng Shuang. In addition, Shuang could not do without causticism at the White House. "The United States is too arrogant." said Shuang. "They mistakenly believe that restricting the export of high technology to China will stop the scientific and technological development of our country." Chinese diplomat "hopes that the United States will do more to build mutual trust and win-win cooperation." According to the latest information, Donald Trump's administration is working on a list of rules that will be aimed at restricting access to high technology for a number of countries that are "rivals" to the United States.
Trading recommendations:
EUR/USD seems to have started a downward trend. Thus, short positions with goals 1.1106 and 1.1049 are relevant now. The first target can be fulfilled today, as expected in the morning. At the same time, breaking through the Ichimoku cloud will strengthen the "dead cross", and also lead to a turn of the Bollinger Bands down. Thus, it is recommended to buy a pair of euro / dollar not earlier than the price fixing above the Kijun-sen line with the first target resistance level of 1.1196.
Explanation of the illustration:
Ichimoku indicator:
Tenkan-sen is the red line.
Kijun-sen is the blue line.
Senkou Span A - light brown dotted line.
Senkou Span B - light purple dashed line.
Chikou Span - green line.
Bollinger Bands Indicator:
3 yellow lines.
MACD indicator:
Red line and bar graph with white bars in the indicators window.
Support / Resistance Classic Levels:
Red and gray dotted lines with price symbols.
Pivot Level:
Yellow solid line.
Volatility Support / Resistance Levels:
Gray dotted lines without price designations.
Possible price movement options:
Red and green arrows.
The material has been provided by InstaForex Company - www.instaforex.com