
Analysis of Wednesday's trades:
GBP/USD 30M Chart
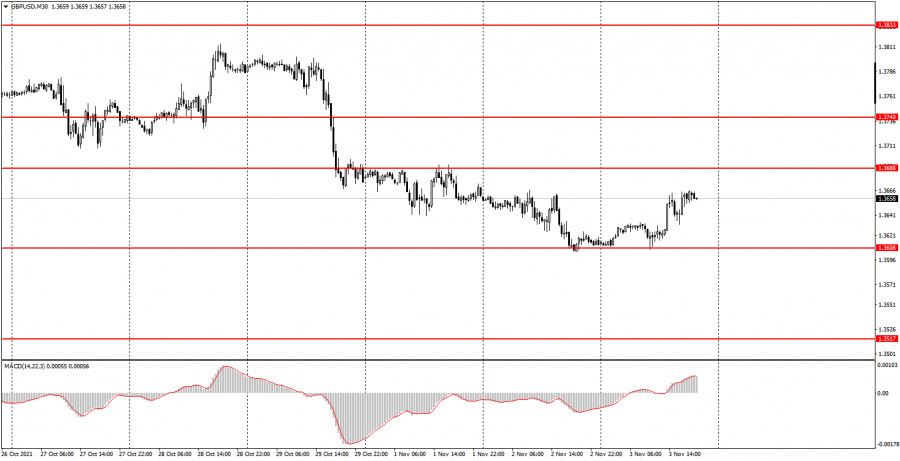
On Wednesday, November 3rd, GBP/USD rebounded from the long-standing support level of 1.3608 on the 30M time frame, thus giving a start to a new upwards run. However, the pound's rally was not directly connected with any macroeconomic statistics or fundamentals published during the day. Markets barely reacted to today's events, so we may conclude that GBP/USD bullish bias is contributed to traders' interest to buy the British currency and sell the American one ahead of the meetings of two central banks. Today, the Federal Reserve will sum up the results of its latest meeting, and tomorrow, the Bank of England will do the same. In connection with that, a surge in volatility is expected these days, so we will need to revise the technical picture no sooner than tomorrow afternoon. At the moment, it is quite difficult to foresee the dynamics of the pair amid the said events. Meanwhile, we should note that the 30M time frame shows no definite trend of the British pound. At the same time, the movement is not flat. So, the current situation in GBP/USD is rather complicated, just as with the Euro.
GBP/USD 5M Chart
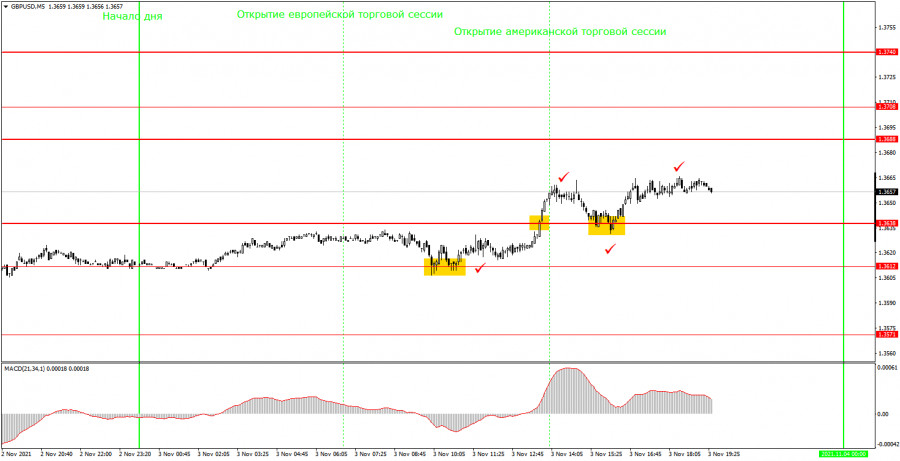
On the 5M time frame, the technical picture is clearer. At any rate, the pair was not stuck in absolute flat for the whole day. It even produced some trading signals, thus providing trading opportunities. At first, beginners should pay attention to the four ticks on the chart above. Each of these ticks reflects some key events in the United Kingdom or the United States scheduled for today. However, it is useless to analyze those events, as they caused almost no reaction from traders. In particular, the ADP report (represented by a second tick) came in stronger than expected, but the US dollar was unable to gain ground 40 minutes after its publication. On the contrary, the greenback declined by 15 pips which was unlikely connected with the ADP data. Similarly, the Services ISM Index also exceeded the forecast, but the US dollar fell after this publication instead of rising. Now let us consider the trading signals. The first BUY signal was formed near the level of 1.3612. Later on, the quote broke above 1.3638, retreated, and then rebounded, resuming its growth. Therefore, we had to close our buy trade manually with a profit of about 40 pips.
Trading plan for Thursday, November 4
At the moment of writing, there was no definite trend on the 30M time frame, and the volatility was low. Under such conditions, it is useless to track the MACD signals as they can prove to be effective only if there is any directional movement. The key levels on the 5M time frame are 1.3608 - 1.3612, 1.3688, 1.3708, and 1.3740. These are Thursday's targets that can serve as break or rebound levels. The Take Profit level should be set at the distance of 40-50 pips. On the 5M time frame, the nearest levels can be used as targets and the profits should be fixed considering the trend strength. After the price goes 20 pips in the right direction, it is better to set Stop Loss at a breakeven point. On November 4, beginning traders should pay attention to the most important events of the day which are the BOE post-meeting statement and Andrew Bailey's speech.
The basic principles of the trading system
1) The strength of the signal depends on the time period during which the signal was formed (a rebound or a break)/ The shorter this period, the stronger the signal.
2) If two or more trades were opened at some level following false signals, i.e. those signals that did not lead the price to Take Profit level or the nearest target levels, then any consequent signals near this level should be ignored.
3) During the flat trend, any currency pair may form a lot of false signals or do not produce any signals at all. In any case, the flat trend is not the best condition for trading.
4) Trades are opened in the time period between the beginning of the European session and until the middle of the American one when all deals should be closed manually.
5) We can pay attention to the MACD signals in the 30M time frame only if there is good volatility and a definite trend confirmed by a trend line or a trend channel.
6) If two key levels are too close to each other (about 5-15 pips), then this is a support or resistance area.
How to read charts:
Support and Resistance price levels can serve as targets when buying or selling. You can place Take Profit levels near them.
Red lines are channels or trend lines that display the current trend and show which direction is better to trade.
MACD indicator is a histogram and a signal line that signal to enter the market when they cross. This indicator is better to be used in combination with trend channels or trend lines.
Important speeches and reports that are always reflected in the economic calendars can greatly influence the movement of a currency pair. Therefore, during such events, it is recommended to trade as carefully as possible or exit the market in order to avoid a sharp price reversal against the previous movement.
Beginning traders should remember that every trade cannot be profitable. The development of a reliable strategy and money management are the keys to success in trading over a long period of time.
The material has been provided by InstaForex Company - www.instaforex.com