
4-hour timeframe
Technical details:
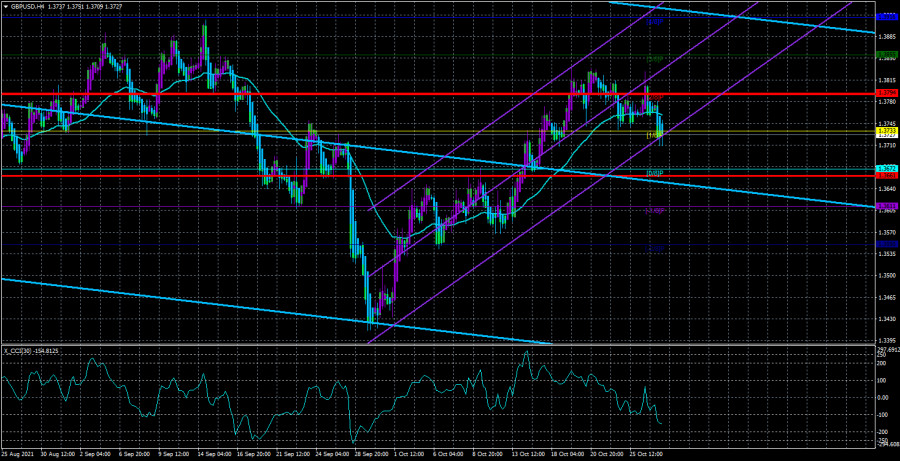
Higher linear regression channel: direction - downward.
Lower linear regression channel: direction - upward.
Moving average (20; smoothed) - sideways.
The GBP/USD currency pair managed to gain a foothold below the moving average line during the third trading day of the week. Therefore, the trend has now changed to a downward one. It cannot be said that this came as a surprise, after all, the pair had been growing for several weeks before. Thus, the hour has come for at least a correction. The question is, will it just be a correction, or is the pair starting a new downward trend? It is better to consider all changes in the pound/dollar pair now on a daily timeframe with a small scale. It is because the pair has been in a very limited, though not sideways range for about 9-10 months. There has been no trend in the last 9-10 months, and the price very often changes direction (for a long-term trend). It seems that there is a downward trend, but in this case, it should be taken into account that the corrections within its framework are quite deep. Thus, if the upward movement of recent weeks was just another correction, now the pair is starting to "aim" for a new round of downward movement with targets below the 34th level. And this is potentially a downward movement of 400 points. On the same daily timeframe, it is visible that the pair once again failed to gain a foothold above the Ichimoku cloud, which only increases the likelihood of a new round of movement to the south. It should also be noted that the fundamental background now remains quite ambiguous. It seems that news on the most hot topics regularly comes from the UK, but at the same time, it is not always possible to link them with the movement of the British currency. Perhaps the last such data was the news about the "fuel crisis", which is part of a much larger "logistics crisis".
Meanwhile, Wales is preparing to be the next to secede from the United Kingdom after Scotland. Recall that Scotland has been talking about a new independence referendum for several years since it does not see its future outside the European Union. The referendum should take place, according to First Minister Nicola Sturgeon, next year. However, separatist messages have recently begun to arrive from Wales. So far, of course, this is all at the level of conversations, but local experts and journalists say that for the first time in a long time, the issue of Welsh independence can be put on the political agenda. The Welsh are also not too happy with Brexit (recall that in the 2016 referendum, mostly the British voted for Brexit), especially now that the whole Kingdom is facing a "logistical crisis" and a shortage of some goods. Energy and electricity prices are also rising. In some sectors of the economy, the strongest price growth is recorded, which is very different from the official statistics on inflation. Thus, at this time, the independence of Wales no longer seems as absurd as it did 5 years ago. And London, led by Boris Johnson, risks getting itself another "headache". Although it may not be Boris Johnson who will lead the country when Wales wants to hold its referendum.
At the same time, the European Commissioner for the Internal Market, Thierry Breton, said that the UK was facing an economic catastrophe because of Brexit. Breton said that Britain now has a difficult situation in the labor market due to a shortage of staff in many areas, as well as a shortage of many goods. The British, already taught by bitter experience in the "fuel crisis", have already begun to stock up on food and goods for Christmas, anticipating even greater shortages and empty shelves in stores. Breton also noted that the British government cannot yet keep its promises about "the prosperity of the nation after Brexit." Rather, the situation is exactly the opposite. Earlier, Boris Johnson was repeatedly criticized, like the entire government of the country, for trying to disguise the terrible consequences of Brexit under the "coronavirus" pandemic.
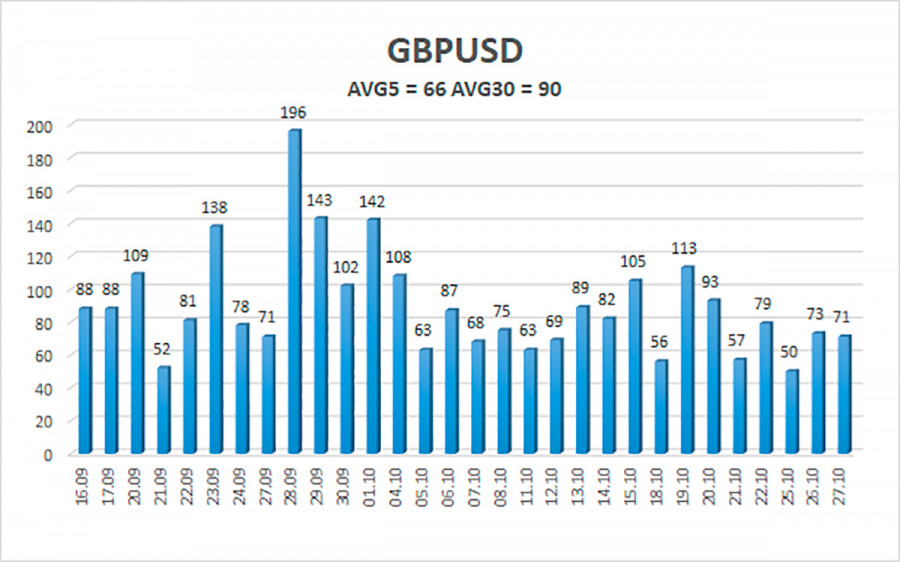
The average volatility of the GBP/USD pair is currently 66 points per day. For the pound/dollar pair, this value is "low". On Thursday, October 28, we expect movement inside the channel, limited by the levels of 1.3661 and 1.3793. A reversal of the Heiken Ashi indicator upwards will signal a possible resumption of the upward movement.
Nearest support levels:
S1 – 1.3733
S2 – 1.3672
S3 – 1.3611
Nearest resistance levels:
R1 – 1.3794
R2 – 1.3855
R3 – 1.3919
Trading recommendations:
The GBP/USD pair on the 4-hour timeframe was fixed below the moving average, so the trend changed to a downward one. Thus, at this time, it is necessary to consider short positions with the targets of 1.3672 and 1.3661 levels before the Heiken Ashi indicator turns upwards. Buy orders can be considered again if the price is fixed above the moving average line with targets of 1.3793 and 1.3855 and keep them open until the Heiken Ashi turns down.
Explanations to the illustrations:
Linear regression channels - help determine the current trend. If both are directed in the same direction, then the trend is strong now.
Moving average line (settings 20.0, smoothed) - determines the short-term trend and the direction in which trading should be conducted now.
Murray levels - target levels for movements and corrections.
Volatility levels (red lines) - the likely price channel in which the pair will spend the next day, based on current volatility indicators.
CCI indicator - its entry into the oversold area (below -250) or into the overbought area (above +250) means that a trend reversal in the opposite direction is approaching.
The material has been provided by InstaForex Company - www.instaforex.com