
GBP/USD 5M
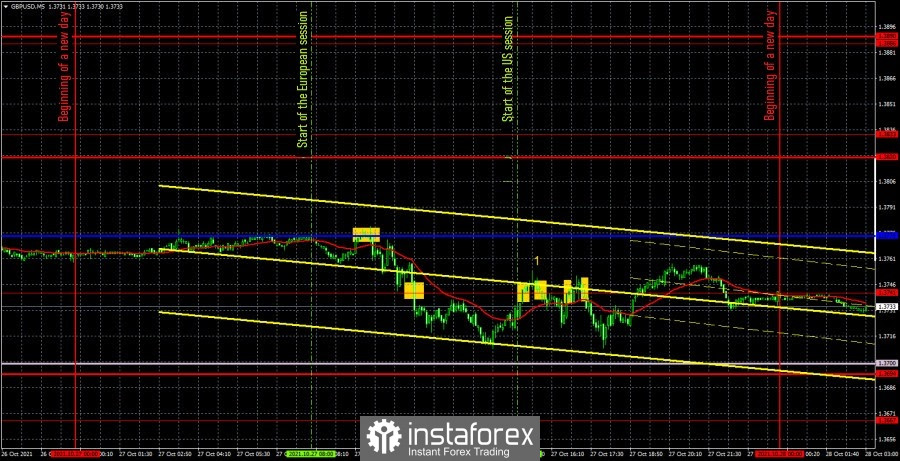
The GBP/USD pair was trading very well on October 27. At first. But then such movements followed that traders hardly wanted to see. Immediately, we note that the only macroeconomic report of the day was the US one for orders for durable goods (the number "1" in the chart). After it, the dollar rose by 20 points, but given the nature of the movement in the US trading session, this could have been a coincidence, not a reaction to the report. So, at the very beginning of the European session, the pair bounced off the Kijun-sen line and this signal was quite strong, so it could be worked out. Subsequently, the price overcame the extremum level of 1.3741 without any problems and fell almost to the Senkou Span B. However, it still did not reach 9 points, so the short position was closed when the price settled above the level of 1.3741. The profit was only 16 points. And then there were such movements that could not bring any profit. Long positions should have been opened on a buy signal near the level of 1.3741, however, the price almost immediately settled below this level, which should have been interpreted as a sell signal. However, in this case, there was a quick reversal in the opposite direction and a new consolidation above the level of 1.3741. Thus, two signals at once near the level of 1.3741 turned out to be false. On the first, a loss of 12 points was received, on the second - 12 points. Thus, the overall loss for the day was not high. Recall that every trade cannot be profitable, so nothing terrible happened. The last two signals near the level of 1.3741 should not have been considered any more, since by that time two false signals had already been formed near this level. It should also be noted that in none of the two cases of false signals, the price passed 20 points in the right direction, which would be enough to place a Stop Loss order at breakeven.
GBP/USD 1H
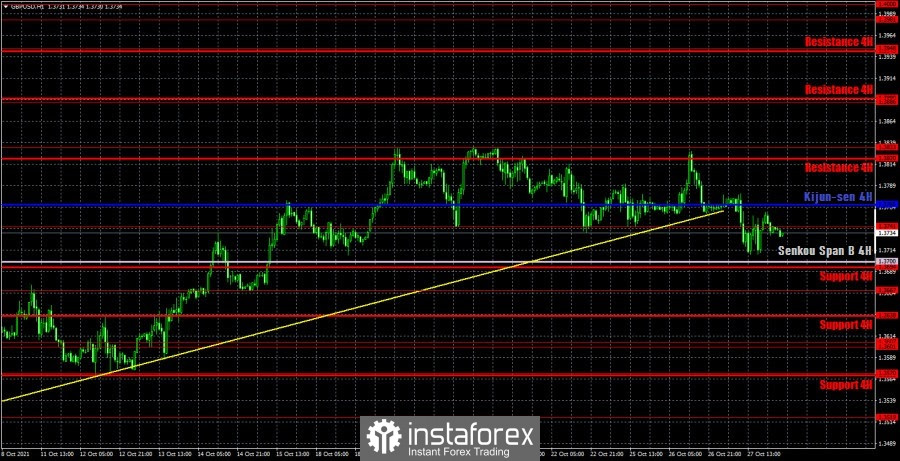
The pound/dollar pair has settled below the upward trend on the hourly timeframe, so the upward trend has now changed to a downward one. The price did not manage to overcome the level of 1.3833, and, in principle, the pound has been rising for quite a long time, so now it is really more preferable to move down. However, the pound/dollar pair has not yet managed to gain a foothold below the Senkou Span B line, so while further downward movement is, if not in doubt, then in doubt. We highlight the following important levels on October 28: 1.3667, 1.3741, 1.3833. Senkou Span B (1.3700) and Kijun-sen (1.3766) lines can also be signal sources. It is recommended to set the Stop Loss level at breakeven when the price passes 20 points in the right direction. The Ichimoku indicator lines can move during the day, which should be taken into account when looking for trading signals. Since the pound/dollar is now also in a flat (not pronounced, but still), the Kijun-sen line is weak, as is the Senkou Span B line. The UK still has an empty calendar of macroeconomic and fundamental events on Thursday. Thus, traders will focus on the report on US GDP for the third quarter. Also there will be a report on claims for unemployment benefits in America, but this report has not provoked any reaction from the markets for a long time.
We recommend you to familiarize yourself:
Forecast and trading signals for EUR/USD for October 28. Detailed analysis of the movement of the pair and trade deals.
COT report
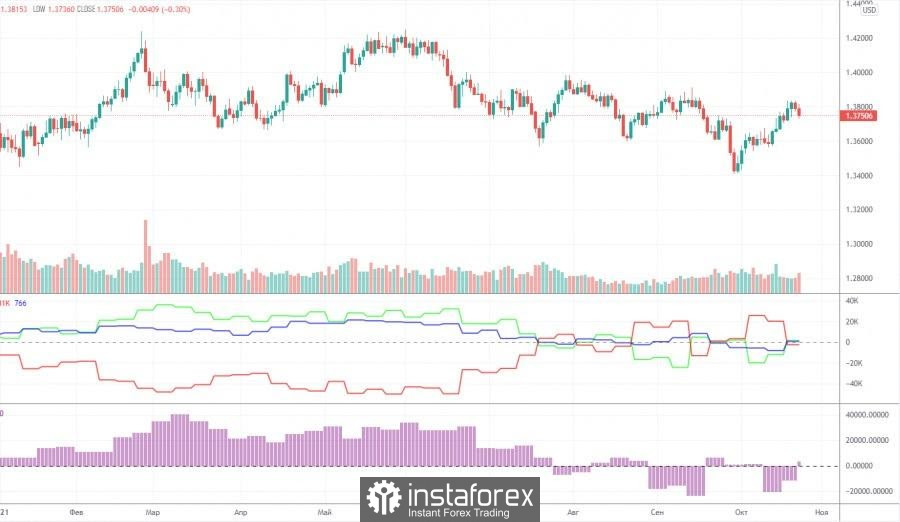
The mood of professional traders became less bearish again during the last reporting week (October 12-18). The situation with the Commitment of Traders (COT) reports is now even more ambiguous than with the technical picture. And if we compare the COT reports for the euro and the pound, then the situation becomes even stranger. Both indicators in the chart above show that large players do not have any clear, precise and understandable mood at the moment. Consequently, now it is simply impossible to make any forecasts based on COT reports. In principle, the chart above clearly shows the entire movement of the pair over the past year. It is rather difficult to call it a trend or even a trend. In the last couple of months, the mood of the big players has been constantly changing. The green and red lines of the first indicator (net positions of groups of traders "commercial" and "non-commercial") are constantly changing the direction of movement. This means that the two largest groups of traders are constantly increasing and decreasing their net positions. During the reporting week, professional traders opened 2,000 buy contracts (longs) and closed 12.5 thousand sell contracts (shorts). Thus, their net position increased by 10.5 thousand contracts. This is in line with what has been happening with the pound in recent weeks (it is rising). Nevertheless, it is impossible to make a long-term forecast, since the net position may fall already by the end of next week. We also pay attention to the fact that the green and red lines of the first indicator are not moving towards each other and are not moving away from each other. Therefore, it is also impossible to talk about any trend now.
Explanations for the chart:
Support and Resistance Levels are the levels that serve as targets when buying or selling the pair. You can place Take Profit near these levels.
Kijun-sen and Senkou Span B lines are lines of the Ichimoku indicator transferred to the hourly timeframe from the 4-hour one.
Support and resistance areas are areas from which the price has repeatedly rebounded off.
Yellow lines are trend lines, trend channels and any other technical patterns.
Indicator 1 on the COT charts is the size of the net position of each category of traders.
Indicator 2 on the COT charts is the size of the net position for the non-commercial group.
The material has been provided by InstaForex Company - www.instaforex.com