
Analysis of previous deals:
30M chart of the EUR/USD pair
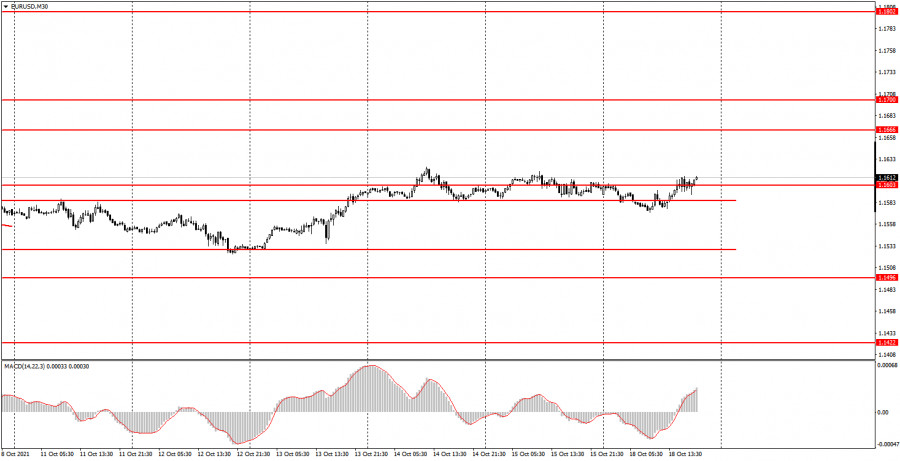
The EUR/USD pair continued to trade ultra calmly on Monday. We have already said in previous reviews that after leaving one horizontal channel, the pair immediately ended up in the other. The price continued to move sideways, only above the level of 1.1584, which is the upper border of the horizontal channel. Thus, there is no trend for the euro/dollar pair at this time. Therefore, it is still not recommended to consider signals from the MACD indicator. The pair's volatility also remains rather weak. Usually it does not exceed 40 points per day. Thus, trading the EUR/USD pair is still quite difficult, or at least inconvenient. Only one macroeconomic report was published on Monday, which did not have any impact on the course of trading. Industrial production in the US turned out to be worse than expected in September, but at that time the dollar showed no interest in such data.
5M chart of the EUR/USD pair

The technical picture looks more eloquent on the 5-minute timeframe. Despite the fact that the volatility was weak again today, several trading signals were formed during the day. Unfortunately, most of them turned out to be false, which, however, is not surprising, since there were two flat periods during the day. However, let's start analyzing trading signals from the very beginning. First, the price reached the level of 1.1580 and bounced off it. It rebounded, since the price drift below the level by 5 points is not a consolidation below it. At this time, the level of 1.1580 has been corrected to 1.1576. However, today the price bounced off it twice at once, forming buy signals. At the first signal, novice traders could open a long position, which should have been held open after the second signal. Subsequently, the price rose to the level of 1.1603 and for a long time could neither overcome it, nor rebound from it. As a result, the price overcame it, so it should have stayed in the long positions, but in total it could not go up 30 points. Therefore, Take Profit did not work, and a little later the quotes settled below the level of 1.1603, so the long position should have been closed in profit of about 13 points. Also at this moment, short positions should have been opened, but this sell signal turned out to be false, since the price almost immediately resumed its upward movement. As a result, the loss is the same 13 points. The last buy signal shouldn't have been worked out anymore.
How to trade on Tuesday:
The flat was canceled on the 30-minute timeframe, but the upward trend was not formed, and the volatility still does not exceed 40-50 points per day. Moreover, the pair continues to trade in another horizontal channel, slightly higher than before. Thus, it is still very inconvenient to trade on the 30-minute TF, and we still do not recommend tracking signals from the MACD indicator. The key levels on the 5-minute timeframe for October 19 are 1.1529, 1.1576, 1.1639 and 1.1666. Take Profit, as before, is set at a distance of 30-40 points. Stop Loss - to breakeven when the price passes in the right direction by 15 points. At 5M TF, the target can be the nearest level if it is not too close or too far away. If it is, then you should act according to the situation or work according to Take Profit. On Tuesday, neither America nor the European Union is scheduled for any important statistics or fundamental events. Thus, the volatility is likely to remain low tomorrow.
On the chart:
Support and Resistance Levels are the Levels that serve as targets when buying or selling the pair. You can place Take Profit near these levels.
Red lines are the channels or trend lines that display the current trend and show in which direction it is better to trade now.
The MACD indicator (14,22,3) consists of a histogram and a signal line. When they cross, this is a signal to enter the market. It is recommended to use this indicator in combination with trend lines (channels and trend lines).
Important speeches and reports (always contained in the news calendar) can greatly influence the movement of a currency pair. Therefore, during their exit, it is recommended to trade as carefully as possible or exit the market in order to avoid a sharp price reversal against the previous movement.
Beginners on Forex should remember that not every single trade has to be profitable. The development of a clear strategy and money management are the key to success in trading over a long period of time.
The material has been provided by InstaForex Company - www.instaforex.com