
According to the news, the pair moved down yesterday and broke through the support line 1.1073, presented in a white bold line, and at the same time tested the pullback level of 76.4% equivalent to 1.1043, presented in a red dashed line. Strong calendar news for the euro is expected today at 08:30 and 09:30 UTC. Overcoming the lower fractal of 1.1037 is quite problematic.
Trend analysis (Fig. 1).
A descending side channel is expected today with the first target and the lower fractal of 1.1037. Upon reaching this level, it is possible to work upward with the goal of 1.1067, the retracement level of 14.6% presented in a blue dashed line.
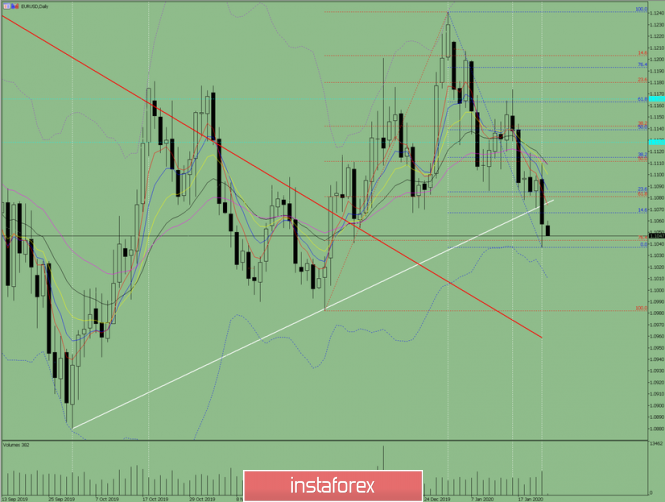
Fig. 1 (daily chart).
Comprehensive analysis:
- Indicator analysis - down;
- Fibonacci levels - down;
- Volumes - down;
- Candlestick analysis - down;
- Trend analysis - down;
- Bollinger lines - down;
- Weekly schedule - down.
General conclusion:
A descending side channel is expected today with the first target and the lower fractal of 1.1037. An unlikely but possible scenario is from the lower fractal 1.1037, the price will go down to the lower border of the Bollinger line indicator 1.1011, presented in a blue dashed line.
The material has been provided by InstaForex Company - www.instaforex.com