
Gold price has broken through support levels and is now challenging the $1,180 level. Trend remains bearish as price is still inside the bearish channel. I have been saying for some time now that as long as price is below $1,211, prices are vulnerable for a move lower towards $1,180 and why not to new 2018 lows.
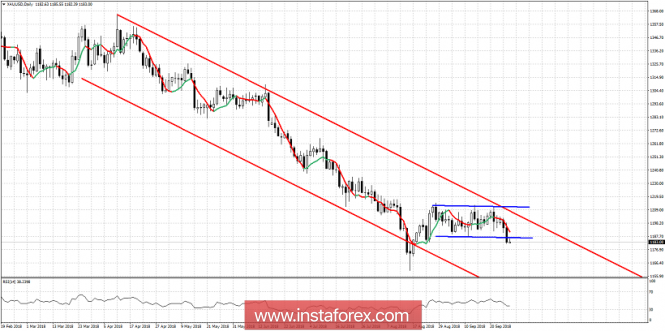
blue lines - trading range
Gold price has broken out of the trading range it was in for the last month. Price initially broke below the short-term support of $1,190 and is now challenging next support at $1,180. Resistance is now found at $1,203 and next at $1,206. As long as Gold is below these levels any bounce is considered a sell opportunity for a move lower towards new lows. Gold's bounce was not as big as we initially anticipated ($1,220) as price mostly moved sideways after topping around $1,215. Short-term trend has changed from neutral to bearish again for Gold.
The material has been provided by InstaForex Company - www.instaforex.com