
To open long positions for GBP / USD, you need:
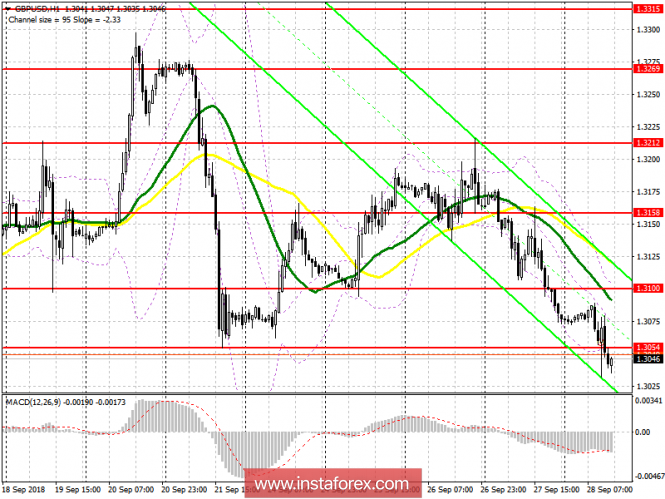
Buyers gave way to the support level of 1.3054, and the main task for the second half of the day will be a return to this range, which could lead to an upward correction in the pound to the resistance area of 1.3100, where I recommend fixing the profits. However, the more appropriate scenario for purchases will be the support for 1.2999, where the market will also be able to observe profit taking on short positions at the end of the week.
To open short positions for GBP / USD, you need:
While the trade is below the level of 1.3054, the pressure on the pound will be maintained, which will lead to a further decrease in the pound to the support area of 1.2999, where I recommend fixing the profits. With the scenario of returning the pound to the resistance level of 1.3054, opening short positions in GBP / USD can be immediately on the rebound from the maximum of 1.3100.
Indicator signals:
Moving Averages
The 30-day moving average and the 50-day average are down, indicating a continued decline in the euro in the short term.
Bollinger Bands
The lower limit of the Bollinger Bands only temporarily kept the pound from falling in the morning. As long as trade is conducted below the middle of the channel, pressure on the pound will continue.
Description of indicators
MA (average sliding) 50 days - yellow
MA (average sliding) 30 days - green
MACD: fast EMA 12, slow EMA 26, SMA 9
Bollinger Bands 20
The material has been provided by InstaForex Company - www.instaforex.com