
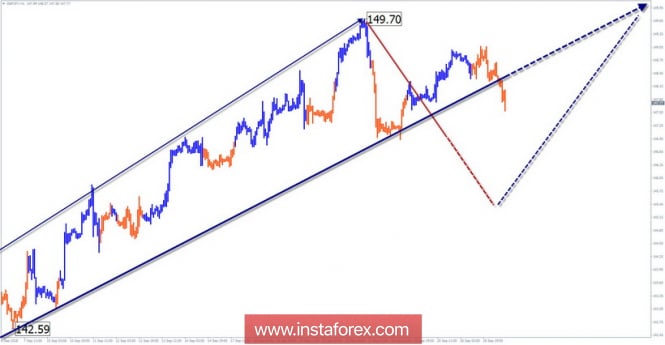
The wave pattern of the H4 graph:
The last wave of this scale completes the downtrend of the daily timeframe. The wave is not complete.
The wave pattern of the H1 graph:
The rising wave from August 15 formed a correctional part (B) in a larger model. Minimum levels passed and the wave lengthened. The most likely zone of completion is within the boundaries of the nearest zone of potential large-scale reversal.
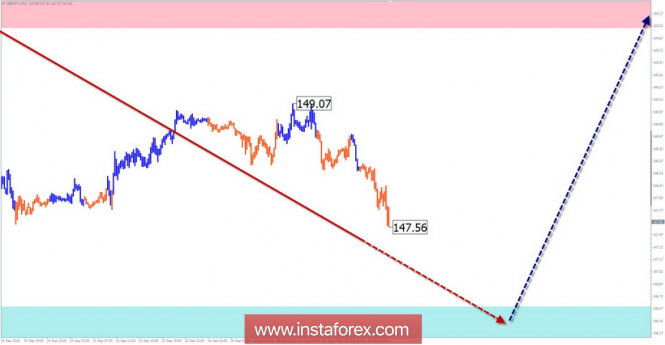
The wave pattern of the M15 chart:
The descending section from September 21 corrects the bullish wave of the higher timeframe. The wave entered the final phase.
Recommended trading strategy:
Sales can be used for trading on the lowest timeframe. or inter-day trading, short-term purchases of the pair may be relevant. Advocates of long-term transactions are prudent to refrain from trading deals until the entire upward wave is completed.
Resistance zones:
- 150.00 / 150.50
Support zones:
- 145.60 / 145.10
Explanations to the figures:
A simplified wave analysis uses a simple waveform, in the form of a 3-part zigzag (ABC). The last incomplete wave for every timeframe is analyzed. Zones show the calculated areas with the greatest probability of a turn.
Arrows indicate the counting of wave according to the technique used by the author. The solid background shows the generated structure and the dotted exhibits the expected wave motion.
Attention: The wave algorithm does not take into account the duration of the tool movements in time. To conduct a trade transaction, you need to confirm the signals used by your trading systems.
The material has been provided by InstaForex Company - www.instaforex.com