
To open long positions for EUR / USD, you need:
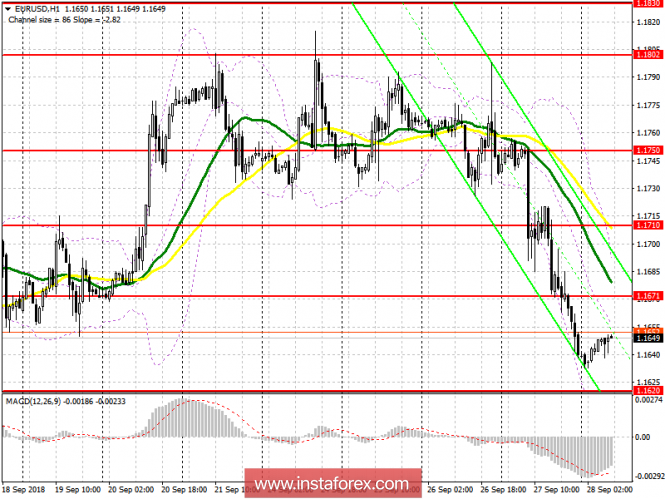
Yesterday, good data on US GDP and orders for durable goods were supported by the US dollar, which led to a fall in the EUR / USD pair in the afternoon. Today, purchases in euros can be viewed when forming a divergence on the MACD indicator from the support level of 1.1620, with the main goal of recovering to the middle of the channel of 1.1645 and updating the resistance level of 1.1671, where I recommend fixing the profits. In the case of a breakout of 1.1620, it is best to return to long positions in EUR / USD after updating the next lows of 1.1590 and 1.1558.
To open short positions on EUR / USD you need:
At the first test of support for 1.1620, a rebound up may occur, and therefore I recommend opening short positions on the breakdown of this area only on a repeated test based on updating the minimums of 1.1590 and 1.558, where it is best to take profits. In the case of EUR / USD growth in the first half of the day, short positions can be returned to the false breakdown from the resistance level of 1.1671, whereby this time, the 30-day moving average will be pulled, or to rebound from the large level of 1.1710.
Indicator signals:
Moving Averages
The 30-day moving average and the 50-day average are down, indicating a continued decline in the euro in the short term.
Bollinger Bands
The euro can be supported by the lower limit of the Bollinger Bands indicator, which is located in the area of 1.1617.
Description of indicators
MA (average sliding) 50 days - yellow
MA (average sliding) 30 days - green
MACD: fast EMA 12, slow EMA 26, SMA 9
Bollinger Bands 20
The material has been provided by InstaForex Company - www.instaforex.com