
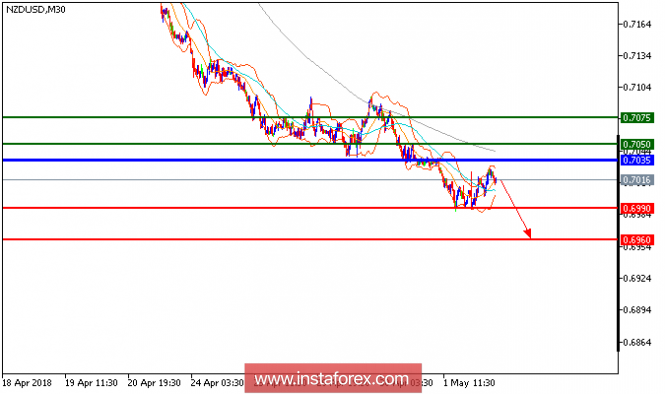
All our downside targets which we predicted in the previous analysis have been hit. NZD/USD is still under pressure. The pair accelerated on the downside following the recent bearish breakout of its key horizontal level at 0.7030, which now acts as a resistance role. The falling 50-period moving average should also push the prices lower towards 0.6960. In addition, the relative strength index is bearish, calling for a further decline. To sum up, as long as 0.7035 is not surpassed, likely decline to 0.6990 and 0.6960 in extension.
Chart Explanation: The black line shows the pivot point. Currently, the price is above the pivot point, which is a signal for long positions. If it remains below the pivot point, it will indicate short positions. The red lines show the support levels, while the green line indicates the resistance levels. These levels can be used to enter and exit trades.
Resistance levels: 0.7050, 0.7075, and 0.7120
Support levels: 0.6990, 0.6960, and 0.6920.
The material has been provided by InstaForex Company - www.instaforex.com