
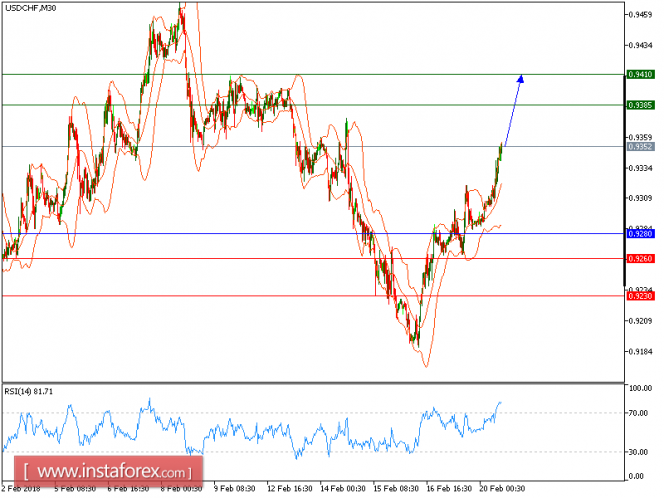
USD/CHF is expected to trade with a bullish outlook. Despite the recent pullback from 0.9320 (the high of February 19), the pair is still supported by a rising 50-period moving average. The relative strength index stands firmly above its neutrality level at 50. The downside potential should be limited by the key support at 0.9280.
Hence, as long as this key level is not broken, look for a new rise with targets at 0.9385 and 0.9410 in extension.
Chart Explanation: The black line shows the pivot point. The present price above the pivot point indicates a bullish position, and the price below the pivot point indicates a short position. The red lines show the support levels, and the green line indicates the resistance levels. These levels can be used to enter and exit trades.
Strategy: BUY, stop loss at 0.9280, take profit at 0.9385.
Resistance levels: 0.9385, 0.9410, and 0.9465
Support levels: 0.9260, 0.9230, and 0.9200.
The material has been provided by InstaForex Company - www.instaforex.com