MG Network

something big isHappening!

In the mean time you can connect with us with via:

Copyright © Money Grows Network | Theme By Gooyaabi Templates

Money Grows Network

Archive

Powered by Blogger.

Welcome To Money Grows Network

Verified By

2006 - 2019 © www.moneygrows.net

Investments in financial products are subject to market risk. Some financial products, such as currency exchange, are highly speculative and any investment should only be done with risk capital. Prices rise and fall and past performance is no assurance of future performance. This website is an information site only.

Popular

Pages

Expert In

Name*


Message*

Ichimoku cloud indicator analysis of gold for February 20, 2018

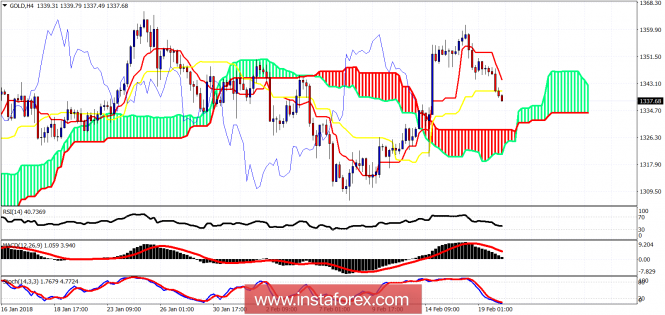
Gold price has broken below the $1,340 level. The price is heading towards the cloud support as expected after getting rejected once again at the $1,350-60 area. The price got rejected for the second time at the long-term resistance level.

analytics5a8bd5f401078.png

In the 4 hour chart, Gold price is still above the Ichimoku cloud (Kumo). Trend is still bullish in cloud terms. Support is found at the $1,328-$1,319 area. This cloud support if broken will make the trend bearish for the short-term. Resistance is found at $1,344 and at $1,351. Bulls need to break at least above $1,344 to regain full control of the trend.

analytics5a8bd6606a87a.png

Magenta line - long-term resistance

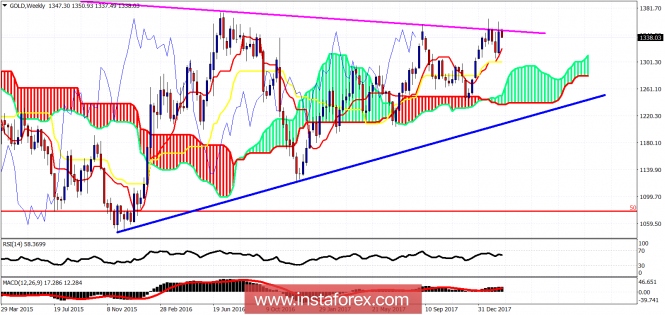
Blue line - long-term support

On a weekly basis, we have started this week with another rejection at the long-term resistance trend line. Support is at $1,319 initially and next at $1,300. Breaking below $1,300 will bring the price towards the important cloud support area that expands from $1,290 to $1,240. A breach of $1,290 could mean a move towards $1,240 or even the long-term trend line. Bulls need to clearly break above $1,350 and hold it. If this is the case, we will have a strong run to $1,400-$1,430.

The material has been provided by InstaForex Company - www.instaforex.com