
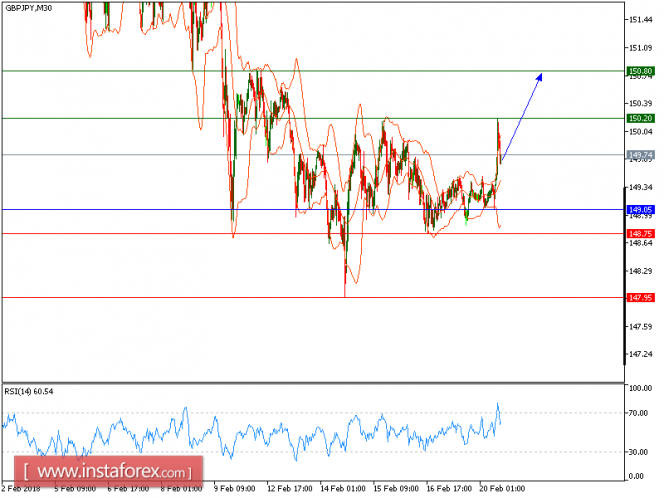
GBP/JPY is expected to trade with a bullish outlook. The pair posted a rebound and broke above its 20-period and 50-period moving averages. In addition, the 50-period moving average is turning up. The relative strength index calls for a new up leg.
To conclude, as long as 149.05 is not broken, look for a further advance with targets at 150.20 and 150.80 in extension.
Alternatively, if the price moves in the direction opposite to the forecast, a short position is recommended to be below 149.05 with the target at 150.
Strategy: BUY, Stop loss at 149.05, Take profit at 150.20
Chart Explanation: the black line shows the pivot point. The price above the pivot point indicates long positions; and when it is below the pivot point, it indicates short positions. The red lines show the support levels, and the green line indicates the resistance levels. These levels can be used to enter and exit trades.
Resistance levels: 150.20, 150.80, and 151.50
Support levels: 148.75, 147.95, and 147.00
The material has been provided by InstaForex Company - www.instaforex.com