
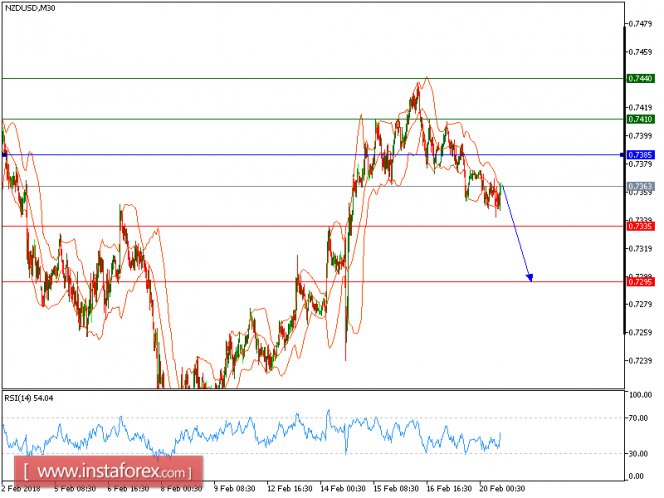
NZD/USD is Under pressure. The pair is trading below its declining 50-period moving average, which plays a resistance role and maintains the downside bias. The relative strength index is below its neutrality level at 50 and lacks upward momentum.
To conclude, as long as 0.7385 holds on the upside, look for a further decline with targets at 0.7335 and 0.7295 in extension.
The black line shows the pivot point. Currently, the price is above the pivot point, which is a signal for long positions. If it remains below the pivot point, it will indicate short positions. The red lines show the support levels, while the green line indicates the resistance levels. These levels can be used to enter and exit trades.
Resistance levels: 0.7410, 0.7440, and 0.7485.
Support levels: 0.7335, 0.7295, and 0.7330.
The material has been provided by InstaForex Company - www.instaforex.com