
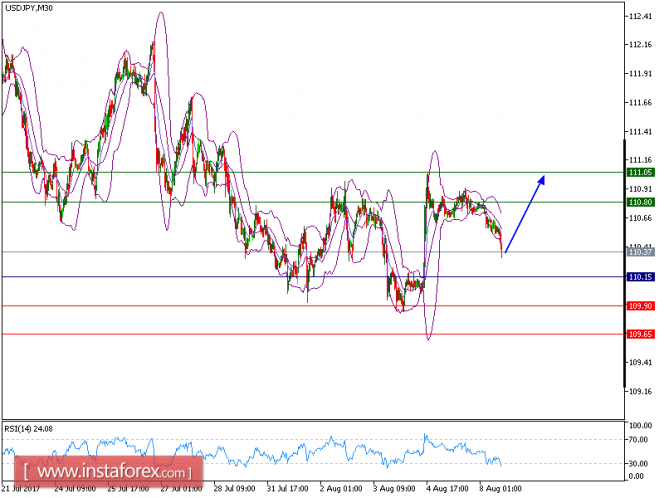
USD/JPY is expected to trade with bullish bias above 110.15. The pair is consolidating above the key support at 110.15, which should limit the downside potential. The relative strength index is above its neutrality level at 50 and lacks downward momentum.
Therefore, as long as 110.15 is not broken, look for a further rise to 110.80 and even to 111.05 in extension.
Alternatively, if the price moves in the opposite direction, a short position is recommended below 110.15 with a target at 109.15.
Chart Explanation: The black line shows the pivot point. The current price above the pivot point indicates a bullish position while the price below the pivot point is a signal for a short position. The red lines show the support levels and the green line indicates the resistance level. These levels can be used to enter and exit trades.
Strategy: BUY, Stop Loss: 110.15, Take Profit: 110.80
Resistance levels: 110.80, 111.05, and 111.40 Support Levels: 109.90, 109.65, 109.35
The material has been provided by InstaForex Company - www.instaforex.com