
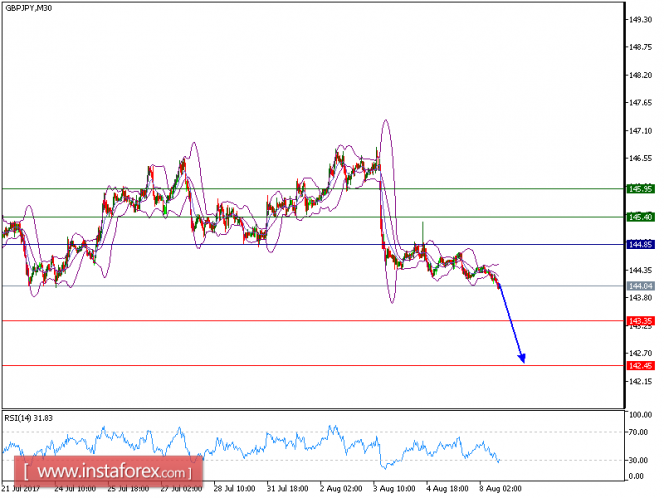
GBP/JPY is expected to trade with a bullish outlook. The pair recorded lower tops and lower bottoms, which confirmed a negative outlook. The declining 50-period moving average is playing a resistance role. The relative strength index is capped by a declining trend line.
To sum up, as long as 144.85 is resistance, expect another decline to 143.35 and even to 142.45 in extension.
Alternatively, if the price moves in the opposite direction as predicted, a long position is recommended above 144.85 with the target at 145.40.
Strategy: SELL, Stop Loss: 144.85, Take Profit: 143.35.
Chart Explanation: the black line shows the pivot point. The price above the pivot point indicates the bullish position and when it is below the pivot points, it indicates a short position. The red lines show the support levels and the green line indicates the resistance levels. These levels can be used to enter and exit trades.
Resistance levels: 145.40, 145.95, and 146.60
Support levels: 143.35, 142.45, and 141.75.
The material has been provided by InstaForex Company - www.instaforex.com