
4-hour timeframe
Technical details:
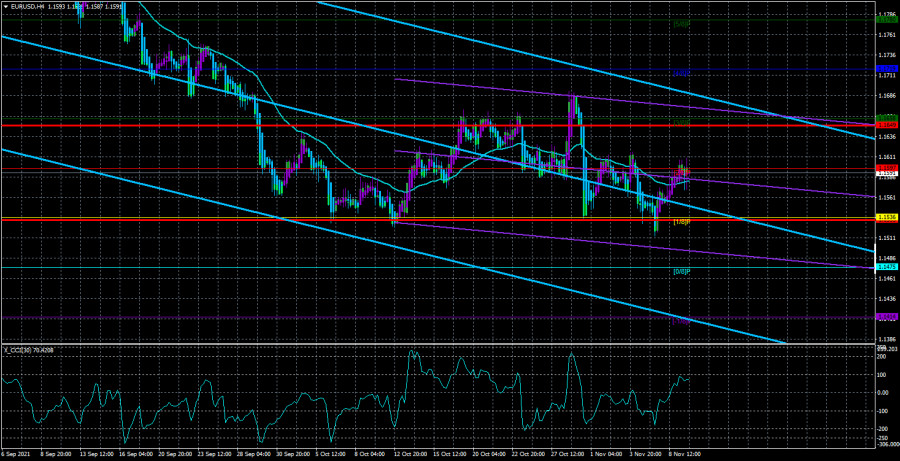
Higher linear regression channel: direction - downward.
Lower linear regression channel: direction - downward.
Moving average (20; smoothed) - sideways.
The EUR/USD currency pair continued indistinct movements on Tuesday. Unfortunately, the more or less powerful movement last week after the Fed meeting remained an isolated case. At this time, it is visible that the bears have not managed to overcome the Murray level of "3/8" - 1.1536. Thus, the prospects for strengthening the US currency remain rather vague. However, if we take into account the fact that the pair continues to move just very sluggishly and very slowly, then the following conclusions can be drawn. For example, can the US dollar rise by 200 points in the next three months? Yes, it can. Can the euro currency rise by 200 points over the next three months? Yes, it can. The problem now is not that the pair cannot or does not want to move up or down, but that all these movements are extremely weak. What's the use of moving 200 points in 2-3 months? In fact, in the current conditions, you either need to use a higher timeframe in trading (a daily or weekly one), and be in one transaction for 5-10 working days, during which you may be able to earn 100 points, or trade at the smallest TF, carefully monitoring any manifestations of the flat. In any case, the technical picture remains as uncomfortable as possible for traders. Recall that this was not always the case. Just a year ago (not to mention earlier periods), the euro/dollar pair regularly passed 60-80 points per day, which allowed it to be traded on any TF. Now, unfortunately, the situation is different. Too much has changed in the world over the past year and a half.
What can the markets pay attention to?
Unfortunately, there is nothing to pay attention to at this time. Which of the upcoming or recent events can be called trend-forming or at least very important? After the Fed meeting last week, the US dollar rose by 100 points, and after the ECB meeting the week before last - by 150 points. But what has it changed for the pair and traders? Let's take another look at the illustration above: the euro/dollar pair has been between the levels of 1.1536 and 1.1658 for a month and a half. And at the same time, this range cannot even be called a side-channel, since the movement itself is unlike a flat. Now the following option is possible: the price will go down 100-200 points at some point in time, after which it will take a break for another one and a half to two months, during which it will trade in a new sideways range. That's how the pair is moving now. Moreover, this judgment is true for almost all timeframes. It is difficult to distinguish anything at all from the "foundation" now. After the meetings of the EU and US central banks were held, the markets were able to understand where both regulators will look in the coming year, but again, what does this change for the euro/dollar pair? Yesterday it became known that about half of the Fed's monetary committee supports one or even two rate hikes next year, but what does this change for the dollar? If this happens, then next year. It is hardly advisable to buy the dollar now, because, in the second half of 2022, the Fed may raise the rate. And in the European Union, there is no question of raising the key rate at all, as Christine Lagarde openly stated. Thus, monetary policy remains a little more hawkish in the United States. But the US also has a slightly more extensive quantitative stimulus program, as well as a "slightly more huge" public debt, which is likely to continue to grow in the near future. Thus, we would say that it is best now to consider the option with a gradual downward correction on the 24-hour TF, but keep in mind that at any moment an upward reversal may occur and the global upward trend will resume.
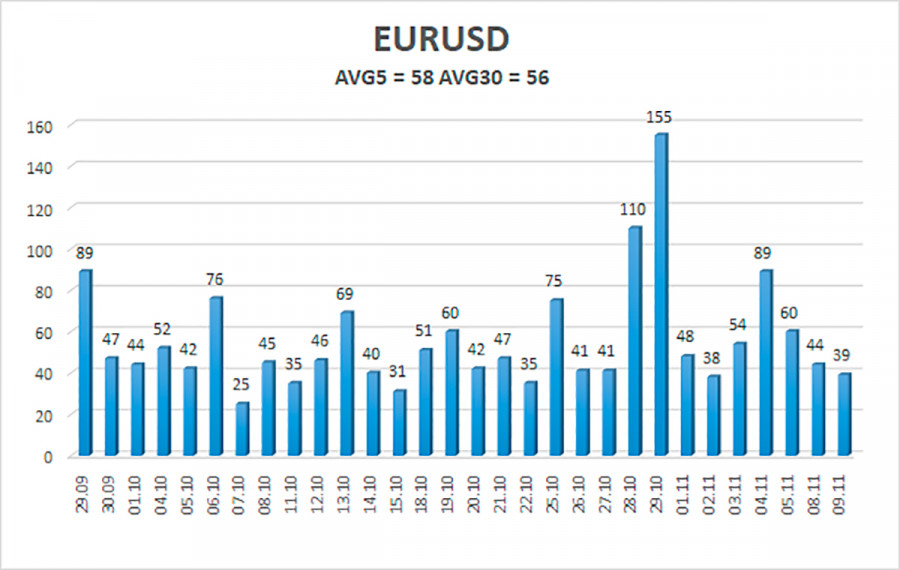
The volatility of the euro/dollar currency pair as of November 10 is 58 points and is characterized as "average". Thus, we expect the pair to move today between the levels of 1.1533 and 1.1649. A reversal of the Heiken Ashi indicator back down will signal a round of downward movement.
Nearest support levels:
S1 – 1.1536
S2 – 1.1475
S3 – 1.1414
Nearest resistance levels:
R1 – 1.1597
R2 – 1.1658
R3 – 1.1719
Trading recommendations:
The EUR/USD pair remains just above the moving average line. Thus, today you should stay in long positions with a target of 1.1649 as long as the price is above the moving average. Sales of the pair should be considered if the price is fixed back below the moving average, with a target of 1.1536. However, it should be taken into account that the whole movement is now as "flat-shaped" as possible.
Explanations to the illustrations:
Linear regression channels - help determine the current trend. If both are directed in the same direction, then the trend is strong now.
Moving average line (settings 20.0, smoothed) - determines the short-term trend and the direction in which trading should be conducted now.
Murray levels - target levels for movements and corrections.
Volatility levels (red lines) - the likely price channel in which the pair will spend the next day, based on current volatility indicators.
CCI indicator - its entry into the oversold area (below -250) or into the overbought area (above +250) means that a trend reversal in the opposite direction is approaching.
The material has been provided by InstaForex Company - www.instaforex.com