
After a local decline provoked by profit-taking by long-term owners, bitcoin began to grow again and as of 13:30 UTC set a new ATH at $69,000. Despite the fact that the current growth is associated with fundamental reasons and it is extremely dangerous to trade now, there is an opportunity to catch an asset on the decline after a bullish rally. To do this, it is necessary to analyze the horizontal charts of the coin and understand the reasons for such a sharp increase in the price of the cryptocurrency.
The main reason for such a sudden growth of bitcoin was the Fed's report on the rate of inflation. According to the latest data, inflation in the United States has exceeded 6.2%, which is a record for the last thirty years. This news served as a signal for action and investors began to buy BTC, as the depreciation of fiat suggests that the demand for a cryptocurrency that protects against it will grow. Thanks to this, the coin has confidently overcome all resistance levels and continues to grow.
It is worth noting that in order to avoid unforeseen losses, it is necessary to monitor the financial calendar of volatility and refrain from trading at the moments of important financial events. The current bitcoin rally is out of the picture and is an impulsive reaction to new objective data. To make sure of this and to predict the point of price decline, it is necessary to analyze different time periods of price movement.
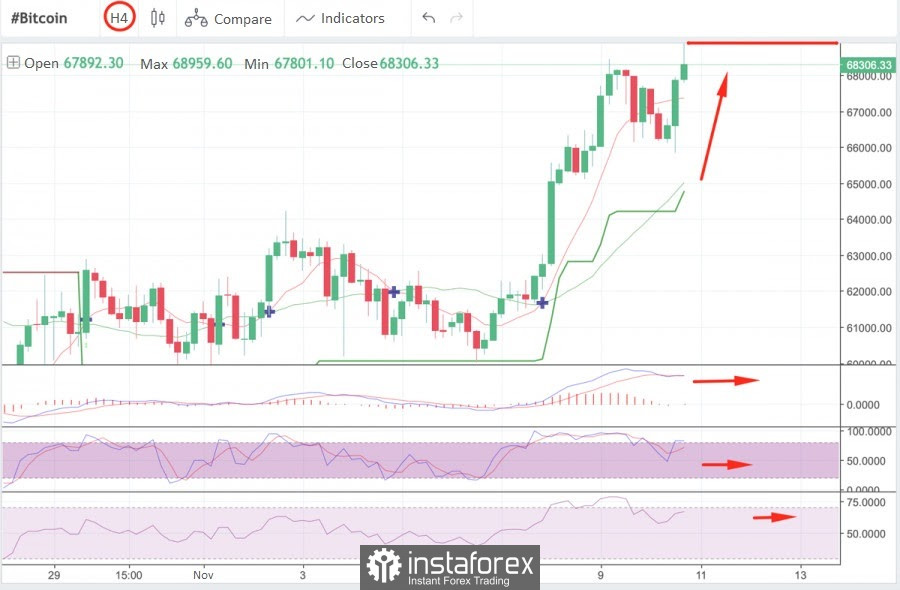
The four-hour chart shows that the first cryptocurrency has made a rebound from the $65,800 area, which can be seen by the long lower wick of the green candle. This suggests that the sellers failed to push the price below the support line, as a result of which the quotes rebounded and began to grow. At the same time, US inflation data were announced, which gave an additional upward impulse to the bullish wave.
Despite the fact that bitcoin has set a new historical record, the prerequisites for further decline are already visible. This can be seen by the long upper tail of the last bullish candle, which means the pressure of sellers who pushed the price down to $68,200. Now the cryptocurrency is trying to resume the upward movement by retesting the $68,200 resistance zone.
The technical charts of Bitcoin begin to signal the weakening of the current bullish momentum: the MACD is moving sideways, and the stochastic is beginning to decline, which indicates the loss of initiative by buyers. The relative strength index also shows a tendency to sideways movement, but is in a bullish zone. Taking into account the long upper wick on the last candle, the positions of bulls and bears are approximately equal, which means that the movement can go in any direction.
On the hourly chart, the situation also looks unstable, but the bears' positions look more confident. After reaching ATH, bitcoin failed to overcome the $68,200 mark, which means that the resistance zone still maintains pressure on the quotes.
With this in mind, the $68,200 mark is an excellent entry zone for a decline, but less than an hour has passed since the Fed's conclusion, which indicates an increased risk of opening short right now.
The instability of the situation is clearly visible on the technical charts: the stochastic oscillator confidently moved upside and subsequently made a sharp pullback, but has already begun to level off. At the same time, the relative strength index began a sideways movement in the bullish zone, which indicates the strength of the upward momentum. While the MACD moves along the red zone and begins a broad bullish ascent beyond the zero mark, which indicates a new impulse to growth.
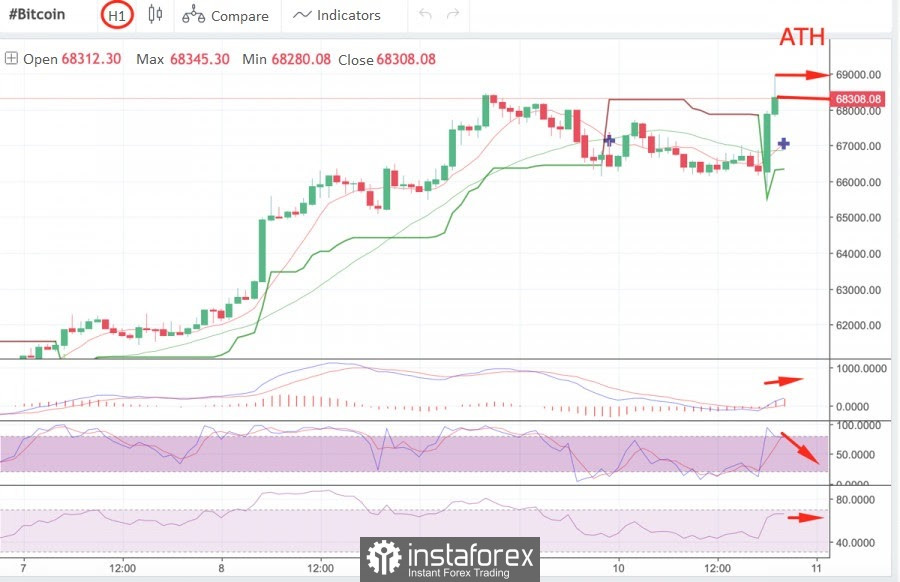
The price met serious resistance in the area of $68,200-$68,300 and, most likely, buyers will try to push the price to the historical maximum, but subsequently, a strong corrective decline will begin, and therefore it is worth waiting for the situation to stabilize.
At the start of the downward movement, the $68,200 mark will be a profitable entry point, but it will not be superfluous to hedge around $68,345 with a stop loss. The price drop will slow down around $66,700-$67,600, but if you exit this range, you can continue to play down to the key support level at $64,400.
The material has been provided by InstaForex Company - www.instaforex.com