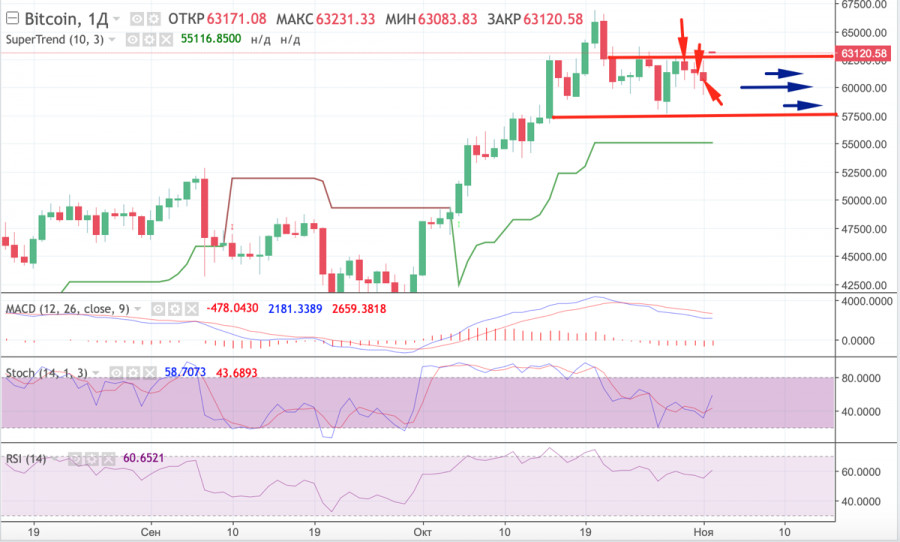
Bitcoin continues confident trading within the narrow consolidation range between $60,500 and $64,000, while gradually approaching its upper boundary. BTC made a bullish breakout of the resistance at $62,500, continued its upward movement, and approached the upper boundary of the current range. As BTC completes its consolidation period, onchain metrics are signaling that a bullish rally is about to resume, which could last much longer than the previous one.
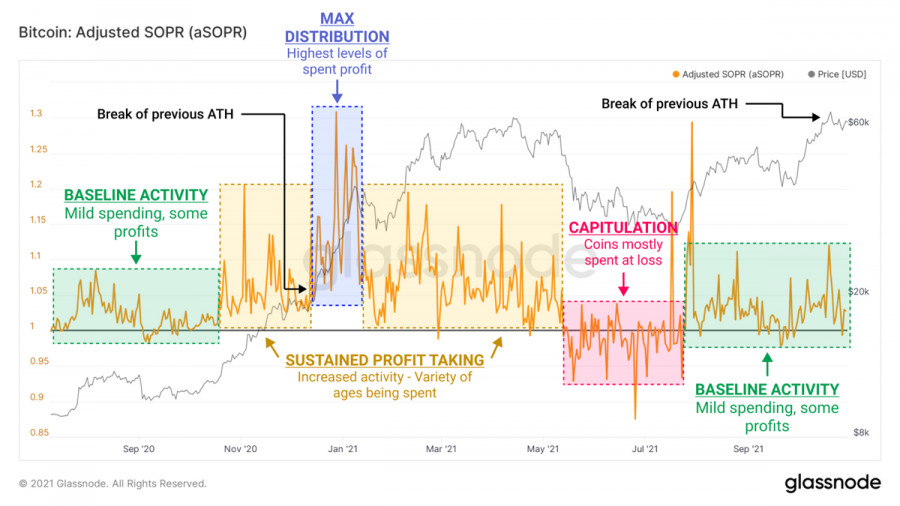
According to Glassnode experts, the end of the previous growth, during which the all-time high was reached, corresponds to the early stage of the bull market. This suggests that the main growth period of the cryptocurrency will begin in the near future upon the completion of price stabilization. According to analysts, the main argument for this is the Spent Output Profit Ratio (SOPR). The SOPR is now above 1, indicating that long-term investors (the main participants of the current bull market) are holding their positions until further upward price movement. Analyzing the indicators of the onchain metric, we can find a historical pattern, according to which after the end of the growth cycle, in which the indicator did not exceed 1.05, the second stage of growth follows, where the SOPR reaches 1.15. In other words, the current period of consolidation is the final component of the initial stage of the BTC rally.
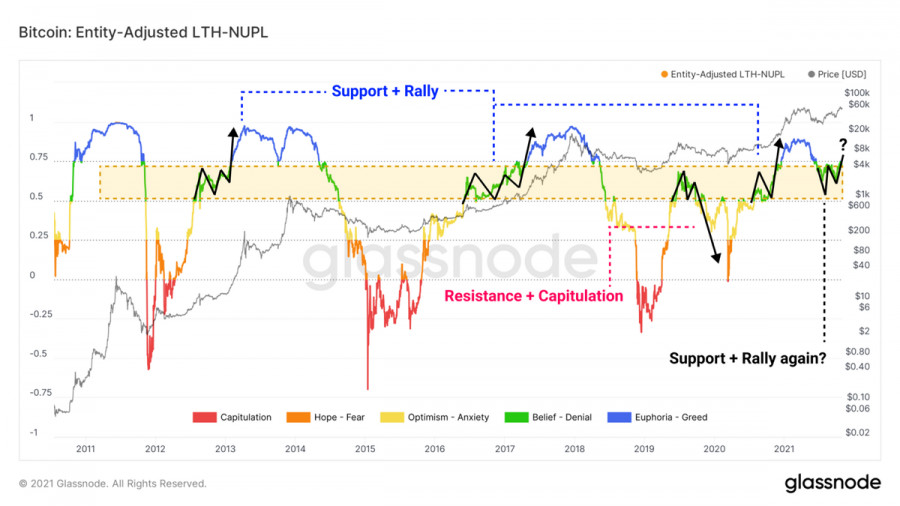
Another important indicator is the Net Unrealized Profit/Loss (NUPL), which reflects the difference between unrealized profits and losses of long-term bitcoin owners. Historically, if this indicator did not breach the 0.5-0.75 range, a strong uptrend would follow over the next few weeks, culminating in a new all-time high. The most important thing here is that this bull market may last longer than 1 month, which is an ambiguous factor for the future growth of BTC. Therefore, when the price moves into the zone of "euphoria", we can talk about the beginning of a bullish rally, which is several weeks long.
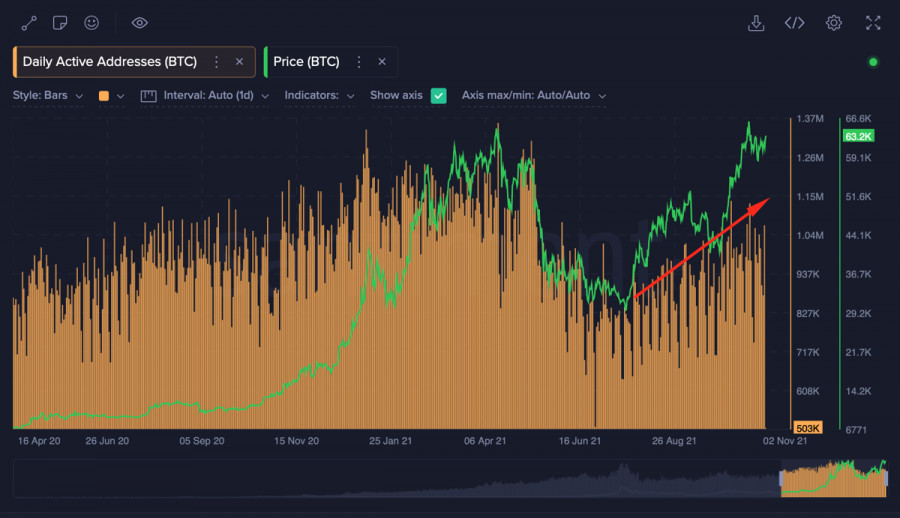
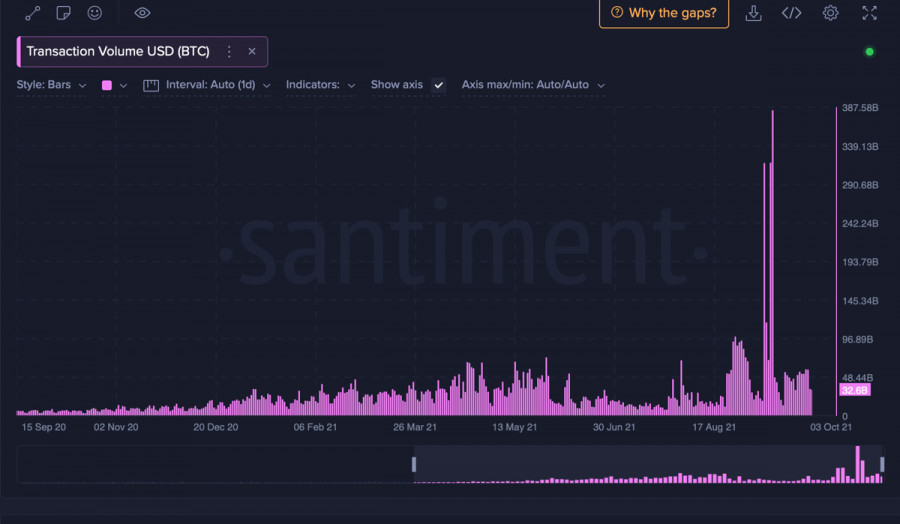
All above is reinforced by growing onchain indicators of the number of unique addresses in the BTC network and transaction volumes remaining at the level allowing the digital asset to reach new all-time highs. In addition, the record low volumes of coins on exchanges and the recovery of hash rate to local highs are important signals for the restoration of BTC dominance, which exceeded 42% again. The Taproot update and the introduction of smart contracts should not be disregarded. These factors may also contribute to the bitcoin rally and increase the retail traders' activity.
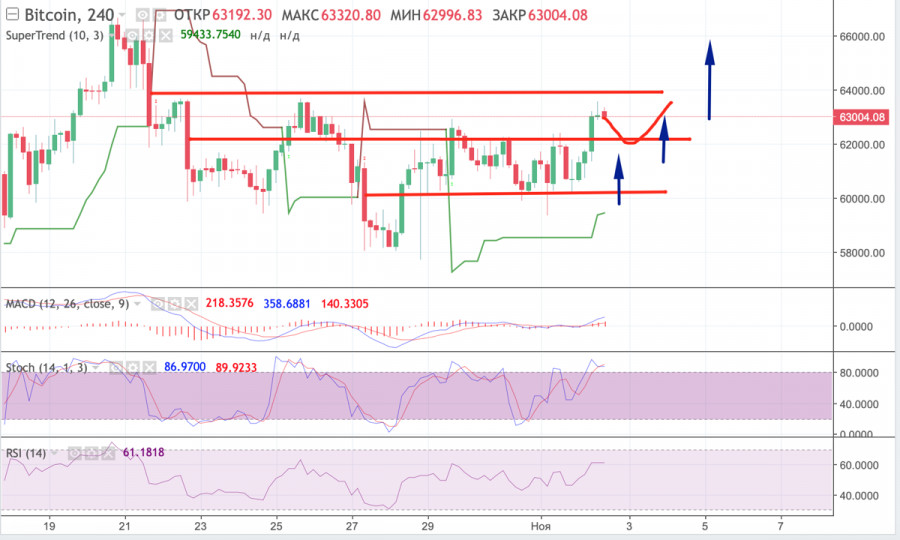
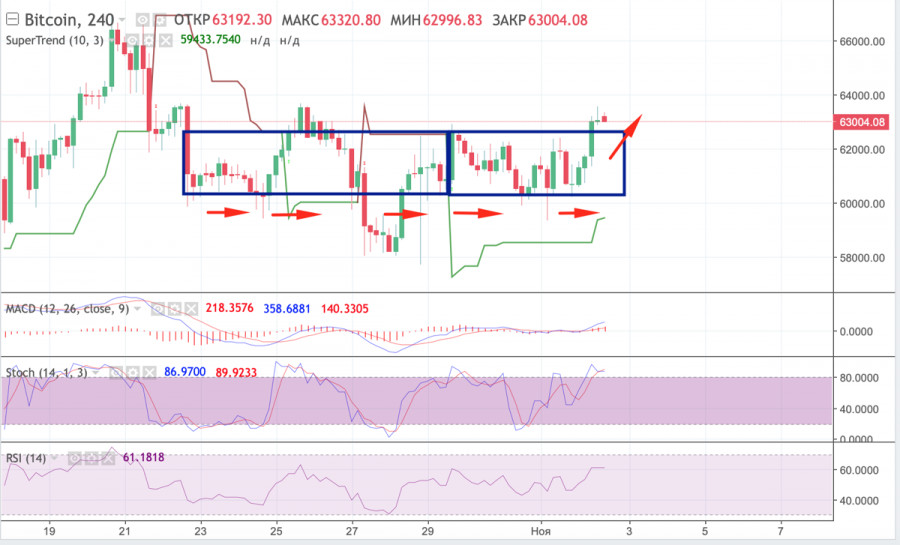
Technically, everything also looks quite positive due to bitcoin's steady movement within a narrow range gradually shifting to its upper boundary. Over the past two days, two important resistance levels triggered by the collapse were broken. Currently, the asset is preparing for a breakout from the resistance area, where the price consolidation took place. On the four-hour chart, BTC made a bullish breakout of the trading range from October 22 and is trying to consolidate above $63,000.
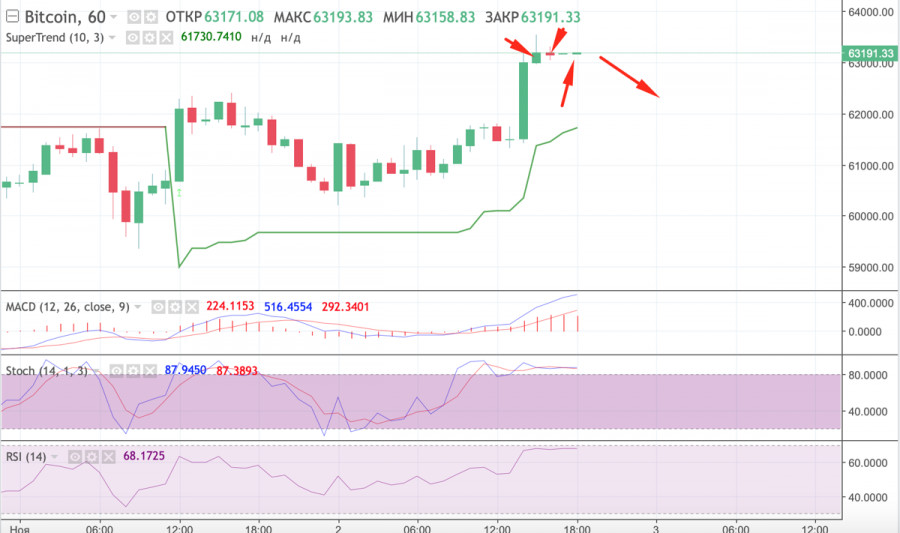
On the hourly chart, the price managed to consolidate above $63,000, but in the last hour the forces of bulls and bears are balanced and therefore the price may go in any direction. The final green candlestick has a long upper wick, which indicates that the sellers are trying to push the price lower. Taking into account the long green candlestick from the previous day, as well as the appearance of the candlestick with a long upper wick, we can assume that the price may correct soon. If the closing price is not above $63,000, we will deal with a false breakout and the price will be kept trading within a narrow range. Despite this, the technical indicators on the hourly chart are moving sideways, which indicates that the price has stabilized locally, but there is a chance that the sellers' pressure may strengthen and the price will have to recover above $63,000 in the future.
On the daily chart, several weak candlesticks were formed in a row, which indicates that the consolidation persists in a narrow range. This may also indicate that a breakout of resistance on the four-hour chart was false and the quotes are likely to return to the usual trading range. Meanwhile, the technical indicators show that the local bullish momentum has started. The stochastic oscillator started a sharp upward movement after forming a bullish cross, while the RSI is slowly approaching 60. Taking all the above into account, bitcoin is likely to continue to hover in the usual trading range, but in the near future, we should expect the formation of a bullish engulfing candlestick and the deployment of a full-fledged bullish rally.