
4-hour timeframe
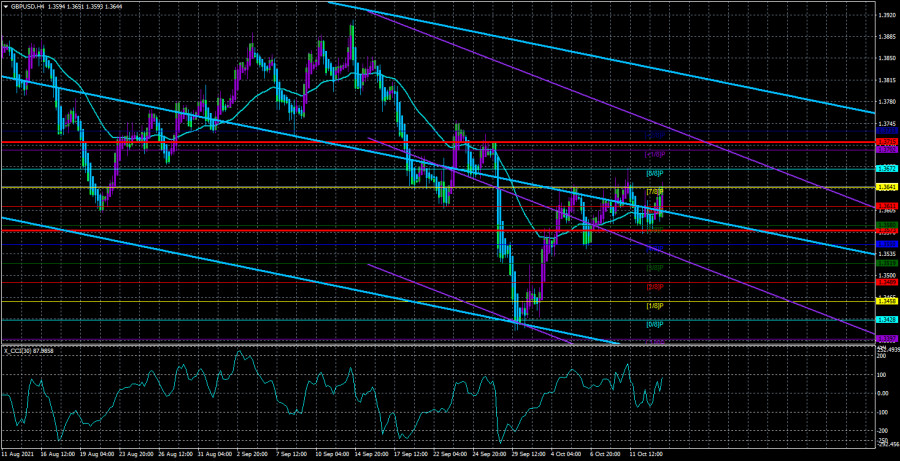
Technical details:
Higher linear regression channel: direction - downward.
Lower linear regression channel: direction - downward.
Moving average (20; smoothed) - sideways.
The GBP/USD currency pair continues to move as unattractively as possible. The movements now resemble most of all "fences" and "Christmas trees." It means that the market has not formed a flat, but at the same time, the price is moving in a kind of side-channel. It can be seen better on the hourly timeframe than on the 4-hour one. Nevertheless, even on the current timeframe, it is noticeable that the pair could not overcome the Murray level of "7/8" - 1.3641. However, it went above it and cannot gain a foothold below the moving average line. Thus, the technical picture is now as confusing as possible.
On the one hand, both linear regression channels are directed downward, but the downward movement cannot resume. The price continues to be located above the moving average line, but it cannot continue to move up. In the current situation, it would be best to wait for the onset of the outcome. It should also be noted once again that macroeconomic statistics have practically no effect on the currency pair's movement. In the last two days, several important reports have been published in the UK, but they have not impacted the British currency. The same can be said about yesterday's report on American inflation. What's the point that the consumer price index suddenly began to rise again, if the US dollar simultaneously rose by "as much as" 25 points, and in the next hour fell by 50? Thus, in the current situation, we would even recommend paying more attention to smaller timeframes and the volatility indicator. By the way, the volatility continues to show how much the markets now want to trade the pair in principle. The average volatility is about 70 points over the last 5-6 days, and for the British currency, this value is very low. Thus, volatility is weak. There is no trend, and "macroeconomics" does not affect the movement of the pair.
Meanwhile, the Committee on Science and Health of the House of Commons of the British Parliament has published a study. The British government has failed in the confrontation with the "coronavirus" pandemic. Earlier, Boris Johnson's former chief adviser Dominic Cummings said something similar, pointing to the complete incompetence of the country's top officials in countering the pandemic. Cummings also noted that a lot of wrong decisions were made, and Boris Johnson and his entourage initially did not attach any importance to the virus, which eventually claimed the lives of 150 thousand Britons, which places the UK in the top ten countries in the world in terms of human losses. The British deputies from the above-mentioned committees concluded that the number of deaths from the "coronavirus" in the country significantly exceeds the figures of other countries comparable to Britain. And this despite the fact that initially the British government was praised for the high level of preparation for the pandemic, and then it turned out that hospitals were overcrowded, the health care system was about to collapse, and most of the medical devices and items were overdue or not suitable for use. The report says that the government's original plan was to achieve collective immunity. Initially, the government allowed the option that most of the country's residents would get sick. As a result, the introduction of the first "lockdown" was too late, and in the first weeks of the pandemic, too little was done to stop the spread of the virus, against which there were no vaccines or medicines at that time. Thus, the report says that the failure of the fight against the "coronavirus" is one of the most serious failures in the history of the British healthcare system. However, the report also notes the vaccination program, which allowed the UK to receive the necessary number of vaccines on time, as well as one of the first in the world to fully vaccinate its population.
What is the result? As a result, the pound/dollar pair is now moving more sideways than up or down. There is no clear trend, so we recommend either trading on the lowest timeframes, or waiting for the trading picture to become more acceptable and understandable.
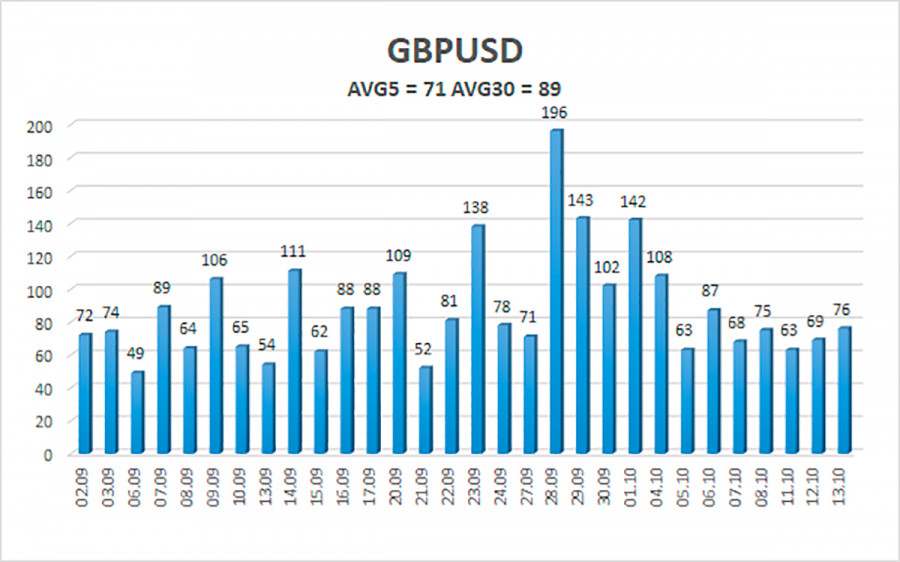
The average volatility of the GBP/USD pair is currently 71 points per day. For the pound/dollar pair, this value is "average". On Thursday, October 14, we expect movement inside the channel, limited by the levels of 1.3573 and 1.3715. A reversal of the Heiken Ashi indicator upwards will signal a possible resumption of the upward movement, although now everything looks more like a flat. Volatility continues to decline after a small spike.
Nearest support levels:
S1 – 1.3611
S2 – 1.3580
S3 – 1.3550
Nearest resistance levels:
R1 – 1.3641
R2 – 1.3672
R3 – 1.3702
Trading recommendations:
The GBP/USD pair has consolidated above the moving average on the 4-hour timeframe. Thus, at this time, it is necessary to consider options for long positions with targets of 1.3672 and 1.3702 levels before the Heiken Ashi indicator turns down. Sell orders can be considered again if the price is fixed below the moving average line with targets of 1.3573 and 1.3550 and keep them open until the Heiken Ashi turns up. Not the worst option now would be to wait for the completion of the flat outside the market.
Explanations to the illustrations:
Linear regression channels - help determine the current trend. If both are directed in the same direction, then the trend is strong now.
Moving average line (settings 20.0, smoothed) - determines the short-term trend and the direction in which to trade now.
Murray levels - target levels for movements and corrections.
Volatility levels (red lines) - the likely price channel in which the pair will spend the next day, based on current volatility indicators.
CCI indicator - its entry into the oversold area (below -250) or into the overbought area (above +250) means that a trend reversal in the opposite direction is approaching.
The material has been provided by InstaForex Company - www.instaforex.com