
4-hour timeframe
Technical details:
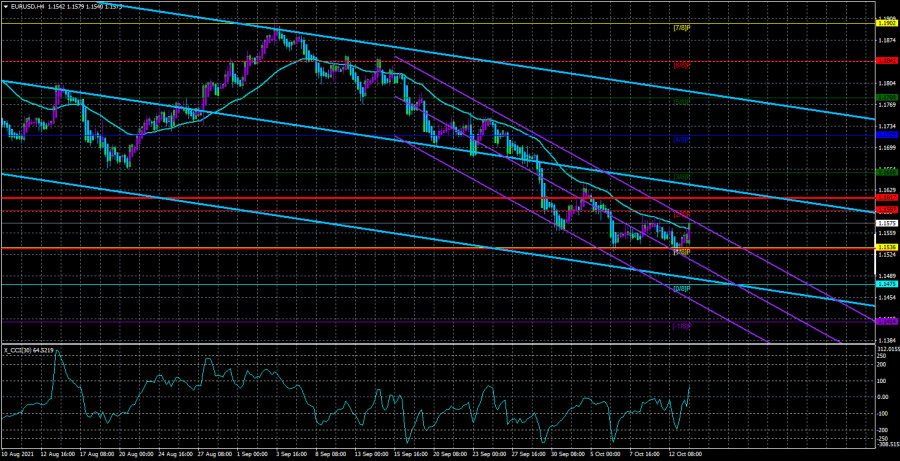
Higher linear regression channel: direction - downward.
Lower linear regression channel: direction - downward.
Moving average (20; smoothed) - sideways.
The EUR/USD currency pair continues to trade very calmly. The illustration above clearly shows that if earlier the downward movement was stable, now it is just scanty, and there is no downward direction. What kind of downward trend can we discuss if the euro/dollar pair has not decreased by a single point over the past six trading days? Thus, we have only one name left from the downward trend since the price continues to be below the moving average line, and both linear regression channels continue to be directed downward. Recall that we are already expecting a new fall in the US currency. However, in recent months, these expectations have been delayed, as the pair's movement has become excessively imposing. Just think about it: the pair has been in a recoilless downward movement for more than a month and during this time managed to go down 380 points. Divide 380 points into 27 working days, and we get that the price goes down every day by an average of 14 points. Returning to our expectations, we still do not find any good reasons for the stable strengthening of the US currency. Since Nonfarm failed and traders ignored most of the rest of the American statistics, there are no special reasons for the dollar's growth. We assume that this is the market's reaction to the very likely curtailment of the Fed's quantitative stimulus program, which may be announced as early as early November. However, recall that initially, many experts expected that a corresponding statement would be made in September. And the dollar continues to grow all the time anyway.
Let's move away from the topic of QE and possible actions of the Fed in November. Let's return to the more pressing problems of America, which still do not have any negative impact on the US dollar. Yesterday, the House of Representatives approved an increase in the national debt limit. Recall that the Senate approved the same decision. The amount by which the limit will be raised is $ 480 billion, and according to various estimates, this money should be enough until the beginning of December. Thus, these are only temporary measures to avoid a "technical default" already on October 18. Now the bill must be signed by US President Joe Biden. However, there will be no problems with this since this is primarily an initiative of the Democrats. Republicans are still opposed to raising the limit by several trillion (as the Democrats want) because they do not see how the Joe Biden administration will repay debts and do not understand where such a huge amount of money will be directed. And the money can be directed to Biden's two packages: "infrastructure" and "social," which are estimated in total at something like $ 5 trillion. However, Republicans do not support such spending within the framework of the two proposed packages, considering them excessive. The Democrats, in turn, recall that during the presidency of Donald Trump, the Republicans themselves supported raising the national debt limit, and then there were no problems with it. Thus, one thing is clear – the political confrontation between Democrats and Republicans continues, which will now drag on for at least another couple of months because it is simply impossible not to agree on a new raising of the debt limit. And probably no one wants to vote for a temporary increase in the limit every two months. A long-term solution is required. Otherwise, the Ministry of Finance will continue to be in limbo, and the US economy itself may begin to experience problems associated with a drop in confidence in it, as well as in the dollar as a global reserve currency.
As mentioned above, such sad news has not yet had any negative impact on the US currency. There is a feeling that the markets do not know what to do with the pair now, so they are trading for show. Recall that the latest COT reports showed an increase in bearish sentiment among major players. However, we do not see any powerful sales on the euro/dollar chart.
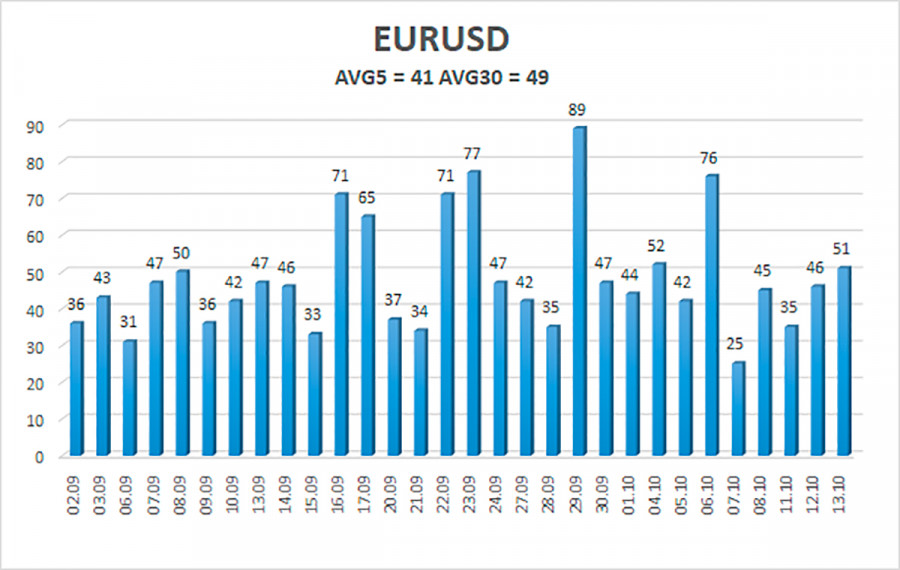
The volatility of the euro/dollar currency pair as of October 14 is 41 points and is characterized as "low." Thus, we expect the pair to move today between the levels of 1.1536 and 1.1617. The reversal of the Heiken Ashi indicator downwards signals a new round of downward movement.
Nearest support levels:
S1 – 1.1536
S2 – 1.1475
S3 – 1.1414
Nearest resistance levels:
R1 – 1.1597
R2 – 1.1658
R3 – 1.1719
Trading recommendations:
The EUR/USD pair is being adjusted again, although all movements are now very conditional. Thus, new sell orders should be opened today with targets of 1.1536 and 1.1475 if the pair remains below the moving average line. Purchases of the pair should be opened if the price is fixed above the moving average with targets of 1.1617 and 1.1658. They should be kept open until the Heiken Ashi indicator turns down.
Explanations to the illustrations:
Linear regression channels - help determine the current trend. If both are directed in the same direction, then the trend is strong now.
Moving average line (settings 20.0, smoothed) - determines the short-term trend and the direction in which to trade now.
Murray levels - target levels for movements and corrections.
Volatility levels (red lines) - the likely price channel the pair will spend the next day, based on current volatility indicators.
CCI indicator - its entry into the oversold area (below -250) or into the overbought area (above +250) means that a trend reversal in the opposite direction is approaching.
The material has been provided by InstaForex Company - www.instaforex.com