
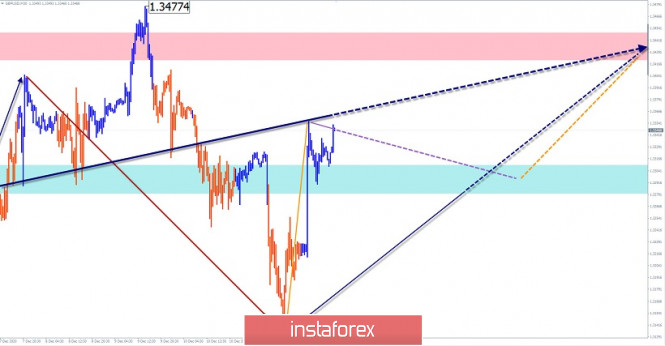
GBP/USD
Analysis:
Quotes of the British pound are confidently returning to the values of the beginning of 2018. The current upward trend continues. Its last section from October 10 is in the area of the intermediate zone of a potential reversal. The wave structure shows the completion of a hidden correction and the formation of a reversal model before a new break in the trend.
Forecast:
In the current day, we should expect the general upward mood of the movement to continue. In the first half of the day, a sideways mood is possible in the area of settlement support. Activation of the pair is likely towards the end of the day.
Potential reversal zones
Resistance:
- 1.3420/1.3450
Support:
- 1.3310/1.3280
Recommendations:
There are no conditions for selling the pound today. It is recommended to track the reversal signals in the area of the support zone to enter long positions.
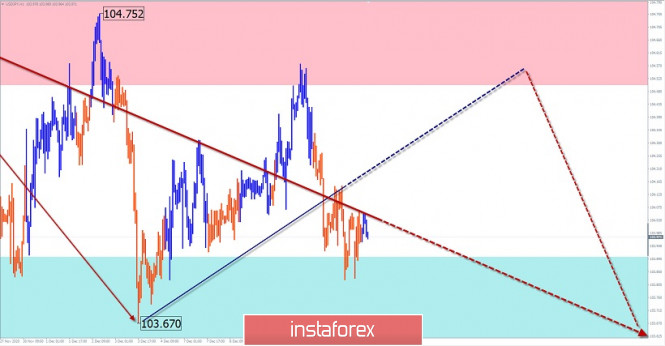
USD/JPY
Analysis:
In the short term, the direction of the Japanese yen is set by the downward wave from November 9. In the structure of the wave, an upward correction has been formed in the last two weeks. Its structure lacks the final section. The price is squeezed between the reversal zones of a large TF.
Forecast:
Today, the price is expected to move in a sideways plane between the nearest counter zones, mainly with an upward vector. By the end of the day, you can expect a change in the exchange rate and a decline to the original values. A breakout of the support zone is likely in the next few days.
Potential reversal zones
Resistance:
- 104.50/104.80
Support:
- 103.90/103.60
Recommendations:
Trading on the yen market today is possible within the intraday. When making purchases, you should reduce the size of the lot used. In the area of the calculated resistance, it is recommended to track the reversal signals for selling the pair.
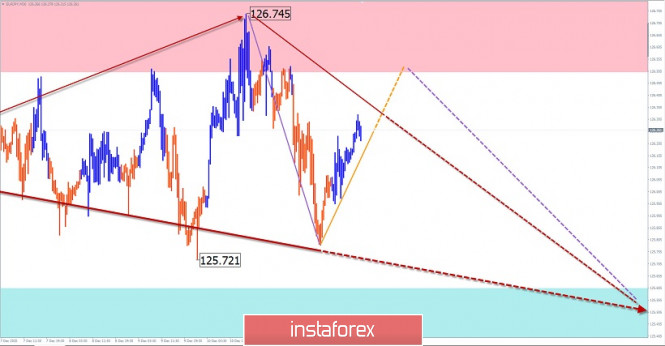
EUR/JPY
Analysis:
The direction of the pair's price movement in the last month and a half points to the north of the price chart. Since the beginning of December, quotes have been moving sideways along a strong resistance, forming an intermediate correction.
Forecast:
In the next trading session, the price rise is expected to continue until it ends in the area of the calculated resistance. Then you can wait for the formation of a reversal and the beginning of a price decline. There is a small probability of a breakout of the support zone in the current day.
Potential reversal zones
Resistance:
- 126.50/126.80
Support:
- 125.60/125.30
Recommendations:
The pair's upcoming moves are against the main trend, so selling the pair may be risky. It is safer to refrain from trading until the entire correction is complete and look for signals to enter long positions at the end of it.
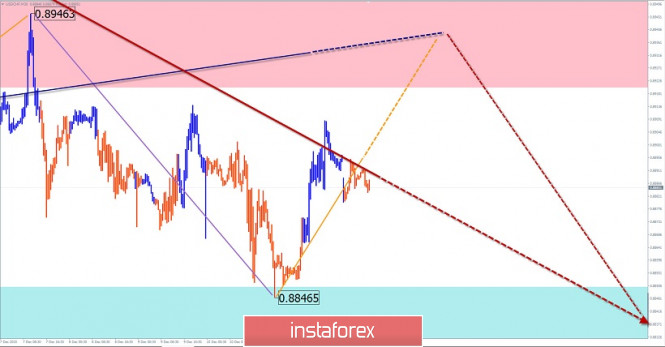
USD/CHF
Analysis:
The chart of the Swiss franc major this year is dominated by the trend of strengthening the national currency against the dollar. On November 11, the final part of the main wave started. In the last 2 weeks, a counter-side correction is formed on the chart in the form of an expanding triangle or "stretched plane" according to Elliott. This wave is nearing completion.
Forecast:
In the next trading sessions, the end of the upward section, the formation of a reversal, and the beginning of a price decline are expected. The last phase may coincide with the release of important news and have increased volatility.
Potential reversal zones
Resistance:
- 0.8920/0.8950
Support:
- 0.8850/0.8820
Recommendations:
When buying a franc, you should take into account the limitations of the current price growth. In the area of the calculated resistance, it is recommended to track the reversal signals for selling the instrument.
Explanation: In the simplified wave analysis (UVA), waves consist of 3 parts (A-B-C). The last incomplete wave is analyzed. The solid background of the arrows shows the formed structure, and the dotted one shows the expected movements.
Note: The wave algorithm does not take into account the duration of the instrument's movements in time!
The material has been provided by InstaForex Company - www.instaforex.com