
The pair moved down on Wednesday and re-tested the support line 1.2972, presented in a red bold line, however, the price was not able to break this line. Strong calendar news not expected today. From the support line 1.2981, presented in a red bold line, an upward movement is possible.
Trend analysis (Fig. 1).
From the support line 1.2981, presented in a red dashed line, it is possible to move up with the first target 1.3044, the pullback level of 38.2% presented in a red dashed line. If this level is reached, the target for the continuation of upward movement is 1.3076, the pullback level of 50.0% presented in a red dashed line.
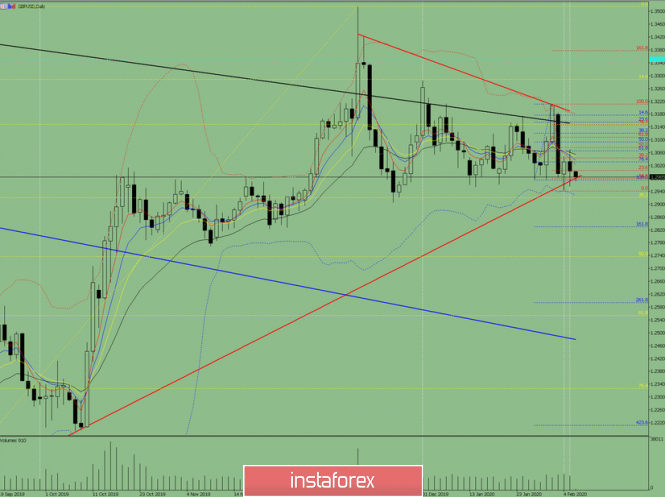
Fig. 1 (daily chart).
Comprehensive analysis:
- Indicator analysis - up;
- Fibonacci levels - up;
- Volumes - up;
- Candlestick analysis - neutral;
- Trend analysis - up;
- Bollinger lines - down;
- Weekly schedule - down.
General conclusion:
Today, the price may start to move up.
An unlikely, but quite possible scenario is from the support line 1.2981, presented in a red bold line, work down with the target 1.2920, the pullback level of 38.2% presented in a yellow dashed line.
The material has been provided by InstaForex Company - www.instaforex.com