
Greetings, dear traders!
New Zealand released important data on the labor market today. The change in the number of employees for the fourth quarter was left at 0%, although the forecast assumed an increase in employment by 0.3%. On the other hand, the unemployment rate declined quite unexpectedly to 4% against expectations of 4.2%.
As you can see, the data on the labor market were mixed. More New Zealand statistics will not be published this week, and all the attention of investors will be focused on labor statistics from the United States, the publication of which is scheduled for this Friday at 13:30 (Universal time).
I believe that this statistics, which is most important for markets, will determine the results for the main (and not only) currency pairs, including NZD/USD.
In the meantime, let's take a look at the technical picture of this instrument and try to determine the future prospects of the New Zealand dollar against the US dollar. However, I'll immediately note that the Friday data on the US labor market can significantly change the technical picture for this and other currency pairs. Much will depend on the specific numbers and the reaction of market participants to them.
Weekly
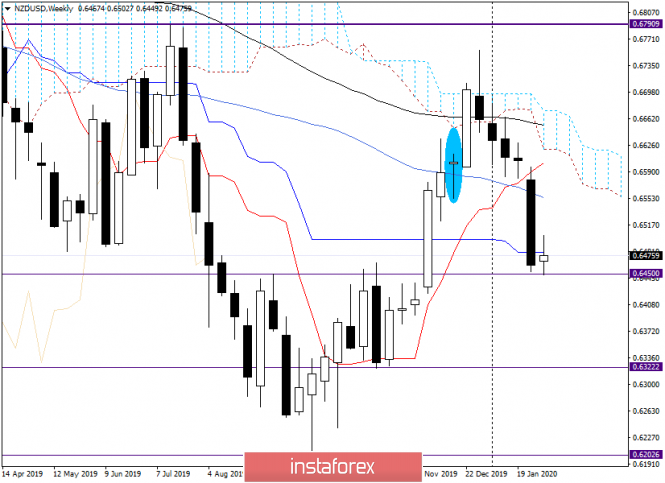
Last week, the "kiwi" finished against the US dollar with an impressive decline and as a result of which, 50 a simple moving average and the Kijun line of the Ichimoku indicator were broken. So, what's next?
At the beginning of this week, the decline continued, but the pair found strong support at a significant technical level of 0.6450 and is trying to recover from previous losses. At this time, the quote is trying to return above the Kijun line, but so far it has been very difficult. It turns out hard, since Kijun has a fairly strong resistance to the price. Let's see how it will go further, since there is still enough time and important events until the end of the current five-day period. Once again, I will express my personal opinion that everything will be decided on Friday after 13:30 (Universal time), when the market gets acquainted with labor statistics from the USA for January.
Now, let's move to the prospects of the "New Zealand" currency. Judging by the weekly schedule, a breakdown of the support level of 0.6450, in my opinion, will inevitably send the pair to another serious and important level of 0.6400, where the further direction of the NZD/USD rate will be decided.
The kiwi bulls have a much more difficult task. In order to take control of the pair, they need to break through the current resistance in the form of Kijun, which is still not possible. If the Kijun passes, the next resistance looms on the horizon, which will be represented by 50 MA, at 0.6554. But this is not all that players need to do to increase the exchange rate in order to get the market for NZD / USD to their hands.
The maximum values of the last week are above 50 MA, at 0.6596. However, the Tenkan line can be placed in this, which is located at 0.6602 and is ready to provide maximum resistance to a possible price increase. Why? Because Tenkan is actually located at a strong technical level of 0.6600, which had a significant impact on the dynamics of the NZD/USD exchange rate more than once or twice.
Based on the analysis of the weekly chart of the pair, the downward option seems to be the most realistic. However, we should not forget about Friday non-farms, which can bring significant changes to the markets.
Daily
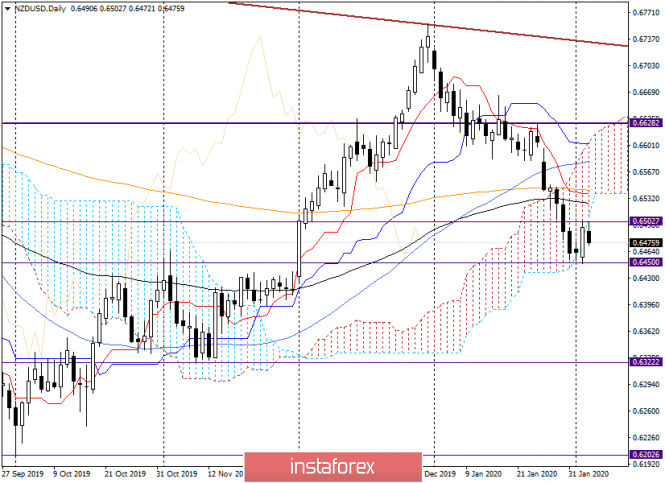
On the daily chart, it can be seen that on one hand, the pair found strong support at 0.6450 and is trying to start recovery from this level, and on the other, strong resistance in the form of psychological and technical level 0.6500 and the lower border of the Ichimoku indicator cloud do not allow quotes to go up.
I believe that a breakdown of the support at the level of 0.6450 or a breakdown of the resistance at the level of 0.6500 will indicate the further direction of the instrument. Of course, at this stage, we can only guess what we will not do with it.
H4
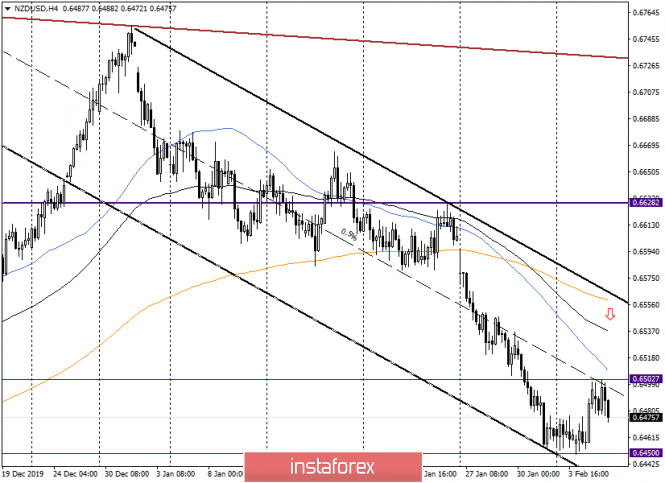
On this chart, the pair is trading in a descending channel and, accordingly, a trend. Let me explain briefly. Finding a moving average of 50 MA(0.6509), 89 MA(0.6537) and 200 EMA at 0.6560 below the resistance line may well provide strong resistance and, along with the support line of the descending channel, make profitable sales.
At the moment, sales from the price zone 0.6509-0.6560 are the best trading idea in my opinion.
Unfortunately, there are no signals to open long positions in the current situation.
Good luck on your profit!
The material has been provided by InstaForex Company - www.instaforex.com