
At the end of the last trading week, the pound / dollar currency pair showed extremely low volatility of 53 points, which leads to a decrease in the amplitude and caution of traders. Now, we will analyze in the current article.
From the point of view of technical analysis [TA], we see that after a surge of short positions on Thursday [October 24], the market, frankly, froze, showing a low amplitude of fluctuation, but still holding a restoring interest in the market. In fact, we saw a stepwise decrease, followed by a focus within 1.2810 / 1.2840, which reflects caution and support from a near range level of 1.2770. In terms of the emotional mood of market participants, we see a clear improvement, the market ceased to concentrate on the inertial movement alone, deliberate tacts and a feeling of high overbought appeared. In turn, the market volatility is not to say that it has subsided, there are still surges, but upon a detailed examination of the last five trading days, we will see that the effect of the characteristic steps, as described above, is present, and it is expressed in a progressive movement, which is very good in terms of recovery.
Analyzing the hourly chart on Friday, we see that there were no pulses at the root, but a narrow amplitude was formed [1.2810 / 1.2840] during the American trading session.
As discussed in the previous review, speculators will fix the previously available short positions and go into the waiting stage, focusing the take-out on the primary slowdown of 1.2834 / 1.2864, with the hope of a subsequent impulse. The tactics, in this case, were according to the "Breakdown of Borders" method, where positions were open, but not all conditions coincided. They were expecting not just a breakdown of the border, but with the support of inertia, which did not happen, but as a result, they got an extension of the amplitude from 1.2834 / 1.2864 to 1.2810 / 1.2864. Moreover, positions continue to be active, having a small profit, followed by a shift in stop loss to the upper boundary zone.
Considering the trading chart in general terms [the daily period], we see that there are no cardinal changes, but there are prerequisites for recovery with respect to the inertia. However, discussion about recovery is not yet actively conducted among traders, but as soon as the quotation is fixed below the range level of 1.2770, everyone will actively talk about the process of returning short positions.
Friday's news background did not have statistics for Britain and the United States, thereby actively monitoring the news feed.
Thus, what was in terms of information flow? - expectations of clarification of the current situation, but the result is more intrigue than facts, for this reason we saw a sluggish stagnation in the trading chart.
Concretize the available information:
The EU countries have agreed to another extension of the Brexit term, but there has not yet been an official announcement of the verdict and the deadlines. It was previously planned that a decision would be made on Friday [October 25], but later the deadline was postponed to Monday. Let me remind you that earlier the opinion of the EU countries regarding the delay period differed, and it seems like France was against the delay of three months.
On the part of the United Kingdom, Prime Minister Boris Johnson's proposal for an early parliamentary election on December 12 was actively discussed, but there was criticism here as well. So, the leaders of the opposition forces of the Scottish National Party (SNP) and the Liberal Democratic Party (LD) are ready to support Johnson's plan for early parliamentary elections, provided that Brexit will be postponed until January 31, 2020.
Comments
"The SNP is ready to support the bill providing for early general elections on Monday, December 9, after the extension of Brexit's term until January 31, 2020 is ensured," the party noted.
On Sunday, the leader of the Liberal Party [Jeremy Corbyn] said that he would not support the government's bid for early elections on December 12, unless tough elections were completely ruled out and this would require not just an extension of the term of three months, but more significant guarantees.
Today, in terms of the economic calendar, we do not have relevant statistics for the UK and the United States, thereby all the attention of market participants will be drawn to the information background. So, today [9:00 Universal time] EU diplomats will meet in Brussels to discuss a proposal for a postponement. At the same time, it is planned to vote in the British Parliament today on account of the early elections.
Further development
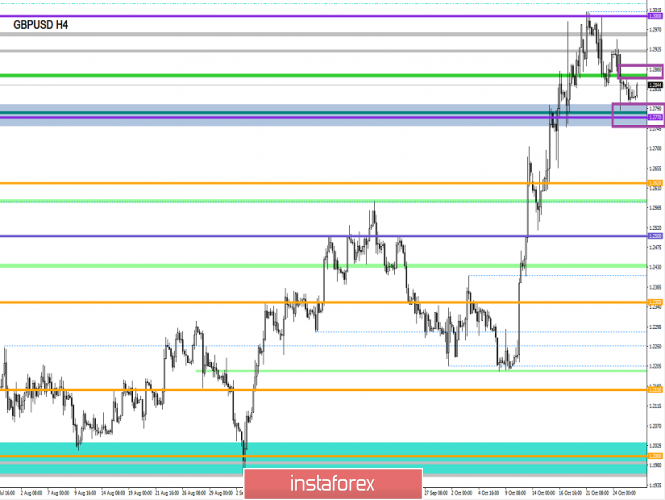
Analyzing the current trading chart, we see a bright slowdown with the characteristic Doji candles [H4], where the quote literally froze under an array of uncertainty and the upcoming stream of information background.
Detailing the constantly fluctuating movement, we see that the motion is invariably horizontal, with floating borders, where I would take the coordinates 1.2810 / 1.2840 relative to the current points. The full width of the swing is 1.2803 / 1.2864.
In terms of the emotional state of the market, we see that the characteristic restraint on short positions is still retained in the market, but perhaps this kind of stop will only benefit future volatility.
In turn, some speculators already have short positions at the time of Friday's pass at 1.2820. Currently, these transactions are being conducted with the movement of the Stop Loss restrictive order to the upper border zone of 1.2864. The rest of the speculators carefully analyze the existing 1.2810 / 1.2840 boundaries for local surges and further refills in existing deals.
It is possible to assume that the prolonged horizontal stagnation will already fall today, and the process of accumulation in the size of one and a half days will resume the growth of volatility. The tactic now is this: the main task is to identify the impulse, if we already have short positions, good, do not forget to place a Stop Loss restrictive order and consider alternative positions in case of an upward breakdown. If we don't have even better positions, we work both up and down, where entry points are calculated relative to Friday accumulations and the beginning of Monday.
Based on the above information, we derive trading recommendations:
- We consider buying positions in case of price fixing higher than 1.2865. If you do not have an encumbrance in the form of having positions, then you can consider a surge of 1.2840 ---> 1.2860, after which 1.2865 fixation is higher.
- We consider selling positions in case of fixing the price lower than 1.2800 with the first point 1.2770. Further progress is considered after a clear fixation of the price lower than 1.2770.
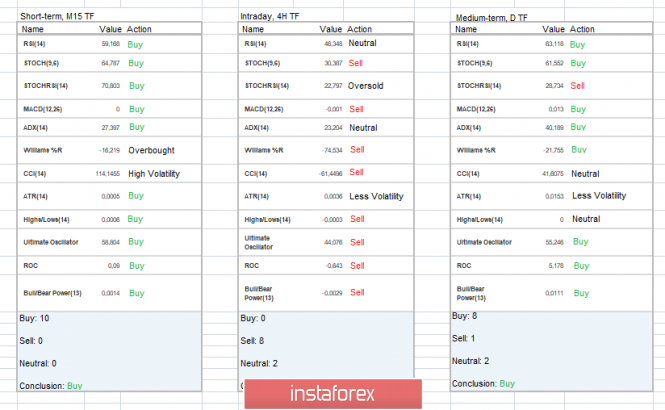
Indicator analysis
Analyzing a different sector of timeframes (TF), we see that the indicators are multidirectional in themselves. Thus, the short-term period works exclusively at the borders of the existing accumulation, constantly changing indicators. Intraday gaps, in turn, are trying to work towards restoring a relatively early inertia while the medium term continues to work at a high inertial rate.
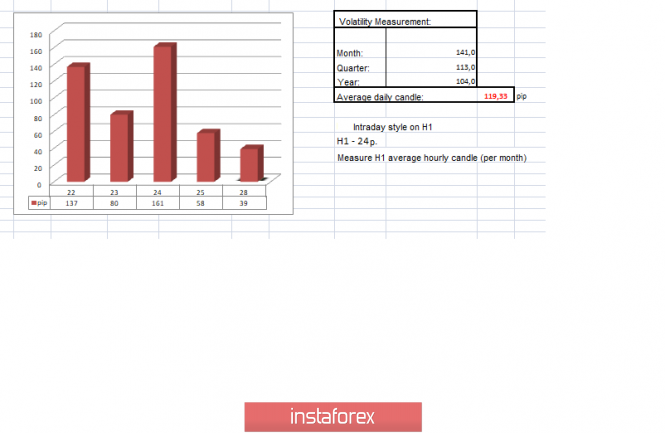
Volatility per week / Measurement of volatility: Month; Quarter; Year
Measurement of volatility reflects the average daily fluctuation, calculated for the Month / Quarter / Year.
(October 28 was built taking into account the time of publication of the article)
The volatility of the current time is 39 points, which is a low indicator for this time section. It is likely to assume that the stagnation that we have under the onslaught of the information background will nevertheless fall and we will see acceleration of volatility.
Key levels
Resistance Zones: 1.3000; 1.3170 **; 1.3300 **.
Support areas: 1.2770 **; 1.2700 *; 1.2620; 1.2580 *; 1.2500 **; 1.2350 **; 1.2205 (+/- 10p.) *; 1.2150 **; 1,2000 ***; 1.1700; 1.1475 **.
* Periodic level
** Range Level
*** The article is built on the principle of conducting a transaction, with daily adjustment
The material has been provided by InstaForex Company - www.instaforex.com