
Trend analysis.
This week, the price will move up with the first target of 1.3011 – the upper fractal (red dotted line). If achieved, the next target is the resistance line of 1.3114 (black bold line).
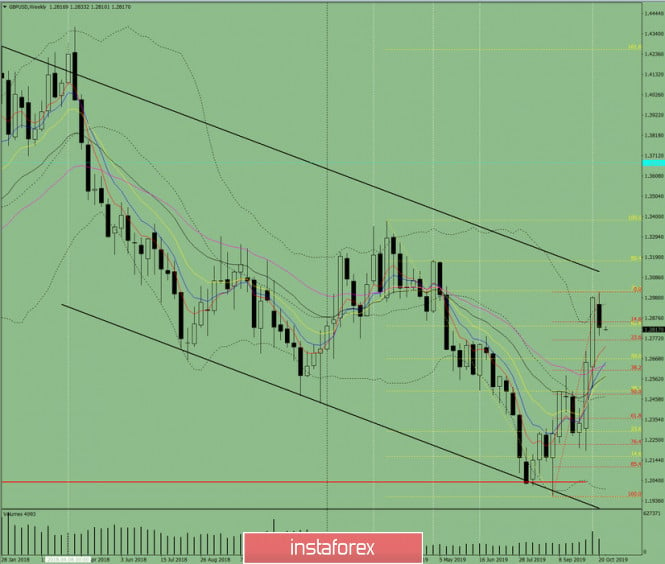
Fig. 1 (weekly chart).
Complex analysis:
- Indicator analysis – up;
- Fibonacci levels – up;
- Volumes – up;
- Candlestick analysis – down;
- Trend analysis – up;
- Bollinger bands – up;
- Monthly chart – up.
The conclusion of the complex analysis – an upward movement.
The total result of calculating the candle of the GBP / USD currency pair according to the weekly chart: the price for weeks will most likely have an upward trend with the presence of the first lower shadow of the weekly white candlestick (Monday – down) and the absence of the second upper shadow (Friday – up).
The upper target of 1.3011 is the upper fractal (red dotted line). If achieved, the next target is the resistance line of 1.3114 (black bold line).
An unlikely scenario is a downward movement with a target of 1.2605 – a retracement level of 38.2% (red dotted line).
The material has been provided by InstaForex Company - www.instaforex.com