
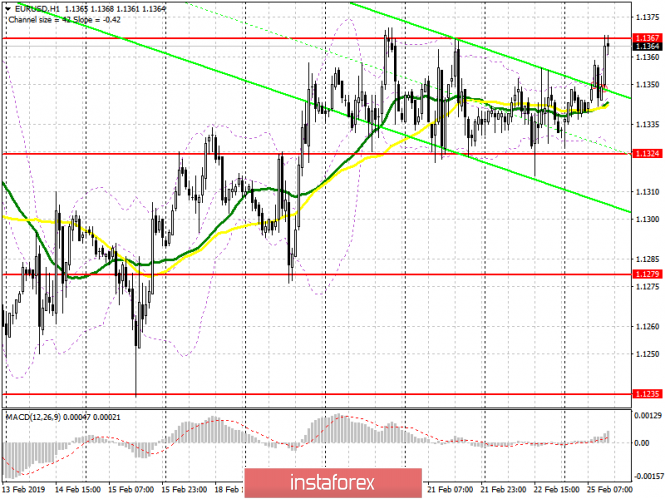
The technical picture of the EUR / USD pair remained unchanged compared with the morning forecast, except for the fact that the pair returned to the upper border of the side channel. Breaking and consolidating above resistance 1.1367 is still required, which will lead to a larger upward correction already in the area of maximum 1.1394 and 1.1432, where I recommend taking profits. In the event of a EUR / USD decline, long positions can be opened given that a false breakdown is formed in the support area of 1.1324 or on a rebound from a minimum of 1.1279.
To open short positions on EURUSD you need :
The lack of important fundamental statistics helps the euro. In the afternoon, sellers will count on the formation of a false breakdown in the area of resistance 1.1367, which will lead to a downward correction to the support area of 1.1324, where I recommend taking profits. The main goal is to break through the lower border of the side channel and reduce to the area of 1.1279 minimum. Under the option of a further upward correction and a break of 1.1367, the euro can be sold for a rebound from the maximum of 1.1394.
More in the video forecast for February 25
Indicator signals:
Moving averages
Trade remains in the region of 30- and 50-moving averages, which indicates the lateral nature of the market.
Bollinger bands
Bollinger Bands indicator volatility is very low, which does not give signals on market entry.
Description of indicators
- MA (moving average) 50 days - yellow
- MA (moving average) 30 days - green
- MACD: fast EMA 12, slow EMA 26, SMA 9
- Bollinger Bands 20