
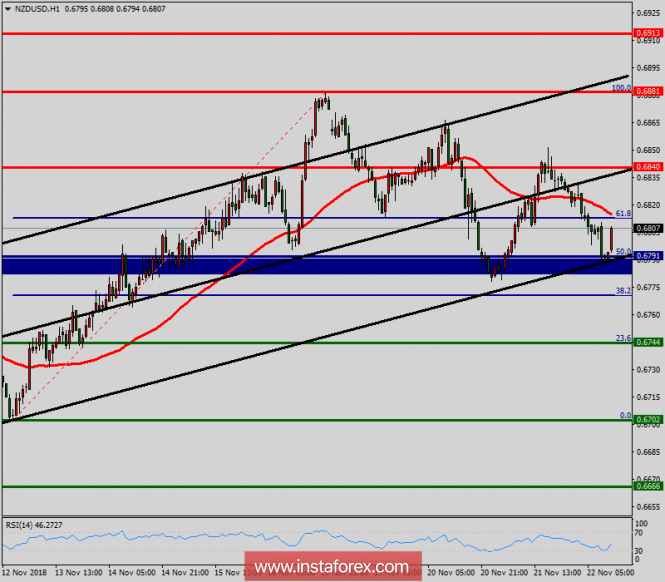
The NZD/USD pair will continue rising from the level of 0.6791 today. So, the support is found at the level of 0.6791, which represents the 50% Fibonacci retracement level in the H1 time frame. Since the trend is above the 50% Fibonacci level, the market is still in an uptrend. Therefore, the NZD/USD pair is continuing with a bullish trend from the new support of 0.6791. The current price is set at the level of 0.6791 that acts as a daily pivot point seen at 0.6791 also. Equally important, the price is in a bullish channel. According to the previous events, we expect the NZD/USD pair to move between 0.6791 and 0.6840. Therefore, strong support will be formed at the level of 0.6791 providing a clear signal to buy with the targets seen at 0.6840. If the trend breaks the support at 0.6730 (first resistance), the pair will move upwards continuing the development of the bullish trend to the level 0.6881 in order to test the double top. In the same time frame, support is seen at the levels of 0.6791 and 0.6744. The stop loss should always be taken into account for that it will be reasonable to set your stop loss at the level of 0.6744.
The material has been provided by InstaForex Company - www.instaforex.com