
The Gold price remains near its 2018 lows. The trend remains bearish and there is no sign of a bullish reversal yet. The Gold price is oversold at current levels and we should focus on bullish trades than bearish ones.
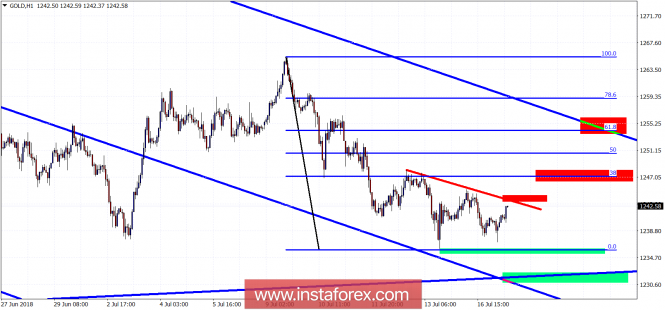
Red rectangles - resistance levels
Blue lines - pitchfork channel
Red line - short-term resistance
Short-term resistance is at $1,244-45. A break above this level justifies a move higher towards the 38% Fibonacci retracement at $1,247. A break above this Fibonacci resistance could push price towards the upper pitchfork boundary and 61.8% Fibonacci retracement level at $1,254. The short-term and medium-term trend could change only on a break above this level. Support is found at $1,235 and next at $1,231.
The material has been provided by InstaForex Company - www.instaforex.com