
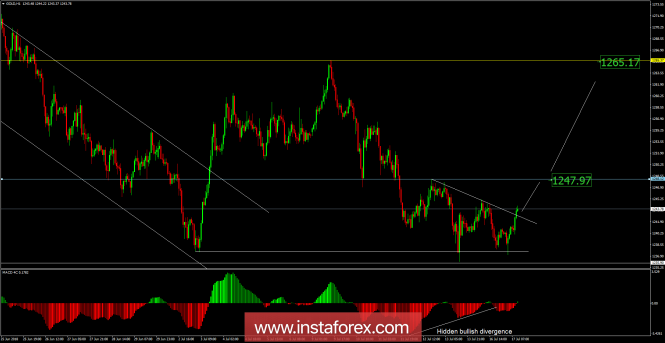
Recently, Gold has been trading upwards. The price tested the level of $1,244.00. According to the H1 time - frame, I found a breakout of the supply trendline in the background, which is a sign that selling looks risky. I also found a fake breakout of the low at the price of $1,237.00 and hidden bullish divergence ont he MACD oscillator, which is another sign of strength. My advice is to watch for potential buying opportunities. The upward targets are set at the price of $1,247.95 and at the price of $1,265.20.
Resistance levels: R1: $1,24295R2: $1,244.35R3: $1,247.00Support levels: S1: $1,238.85S2: $1,236.15S3: $1,234.75
Trading recommendations for today: watch for potential buying opportunities.
The material has been provided by InstaForex Company - www.instaforex.com