
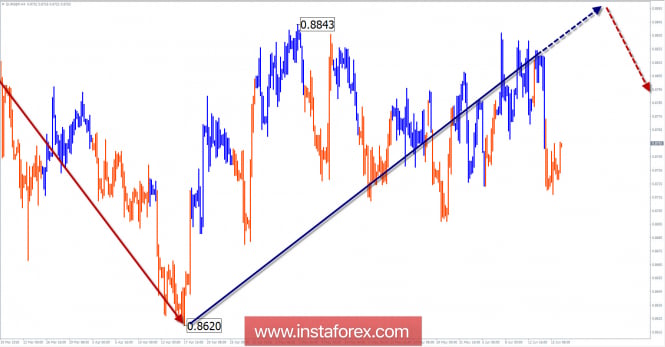
The wave pattern of the H4 graph:
An unfinished wave of this scale of the cross plot can be considered a bearish sector of March 7. In a larger wave model, it took the place of the final part (C).
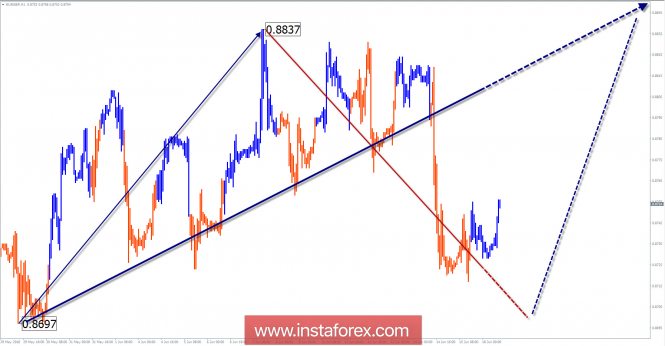
The wave pattern of the H1 graph:
Within the framework of a bigger formation from April 14, the price forms an upward wave. The structure of the movement shows working out of the middle part (B).
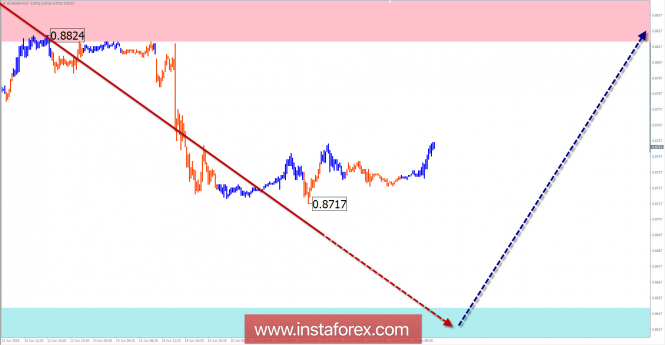
The wave pattern of the M15 chart:
The bearish wave of June 7 reached the upper boundary of the calculated target zone at the time of analysis. Its structure had been formed, but there are no signals of a reversal.
Recommended trading strategy:
Sales are risky, due to the limited reduction. In the area of the estimated support area, it is necessary to track the signals for buying a pair.
Resistance zones:
- 0.8820 / 0.8870
Support zones:
- 0.8650 / 0.8600
Explanations to the figures:
A simplified wave analysis uses a simple waveform, in the form of a 3-part zigzag (ABC). The last incomplete wave for every timeframe is analyzed. Zones show the calculated areas with the greatest probability of a turn.
Arrows indicate the counting of wave according to the technique used by the author. The solid background shows the generated structure and the dotted exhibits the expected wave motion.
Attention: The wave algorithm does not take into account the duration of the tool movements in time. To conduct a trade transaction, you need to confirm the signals used by your trading systems.
The material has been provided by InstaForex Company - www.instaforex.com