
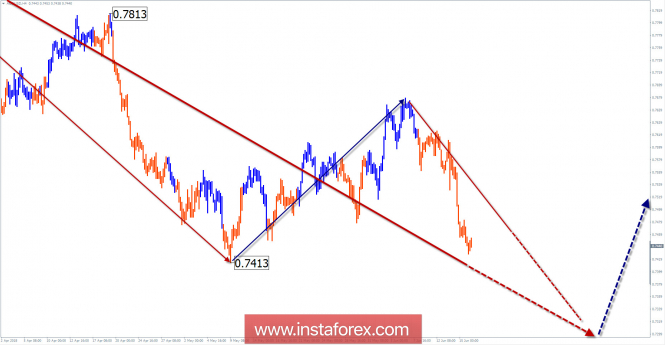
The wave pattern of the H4 graph:
The direction of short-term trends of the "Aussie" major pair sets the downward wave algorithm from January 26. In a larger model, the section completes the wave structure (A-B-C), which explains the overall impulsive nature of the motion.
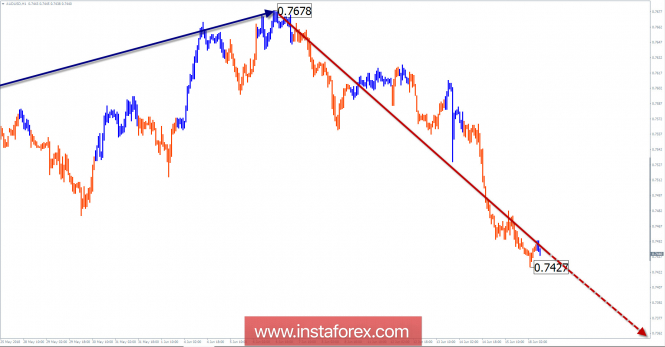
The wave pattern of the H1 graph:
The ascending segment of the graph dated May 9 completed the irregular upward correction of the pair. The bearish phase that began later has a great potential.
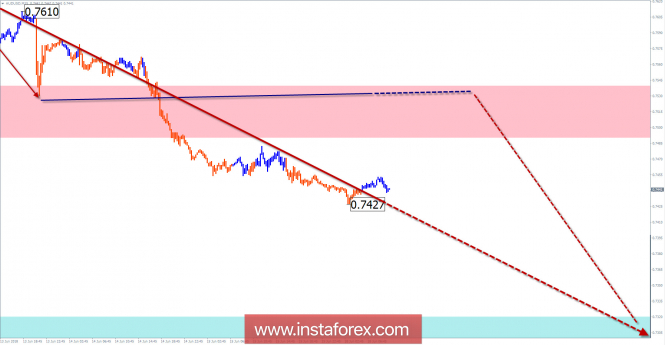
The wave pattern of the M15 chart:
Since June 6, the downward wave is developing. On a larger scale, it begins to form the final part (C) of the main trend. In the coming days, the price is expected to roll back up.
Recommended trading strategy:
Traders who are trading in higher timeframes before buying should wait for the completion of the current bearish wave. On a smaller scale, trade is recommended for the sale of tools.
Resistance zones:
- 0.7490 / 0.7540
Support zones:
- 0.7320 / 0.7270
Explanations to the figures:
A simplified wave analysis uses a simple waveform, in the form of a 3-part zigzag (ABC). The last incomplete wave for every timeframe is analyzed. Zones show the calculated areas with the greatest probability of a turn.
Arrows indicate the counting of wave according to the technique used by the author. The solid background shows the generated structure and the dotted exhibits the expected wave motion.
Attention: The wave algorithm does not take into account the duration of the tool movements in time. To conduct a trade transaction, you need to confirm the signals used by your trading systems.
The material has been provided by InstaForex Company - www.instaforex.com