
Technical outlook:
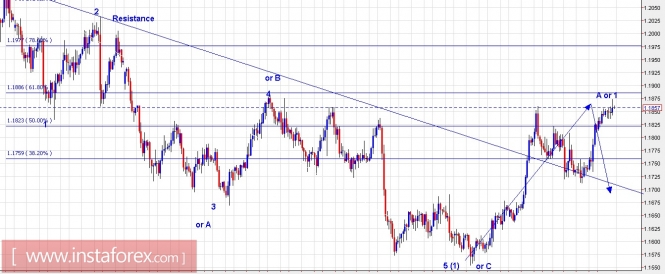
The EUR/USD pair has pushed higher towards 1.1874 levels until now. Believe it or not, the pair is very close to fibonacci 0.618 resistance as seen on chart view here. The entire drop between 1.2092 through 1.1550 levels can be still defined as a potential leading diagonal (labelled as 5 waves down), terminating into wave (1); or it could be defined as an A-B-C corrective drop. The subsequent rally towards 1.1874 levels can be defined as wave A within an A-B-C counter trend rally or wave 1, within a 5 wave impulse rally that could lead to potential highs above 1.2092 levels. Having discussed both the wave counts here, the most common output for prices to take a direction from here is move south, at least towards 1.1650/1.1700 levels from here. Immediate resistance is seen at 1.1880/90, while support is at 1.1700 levels.
Trading plan:
Remain short again, risk above 1.2050, target at least 1.1650.
US Dollar Index chart setups:
Technical outlook:
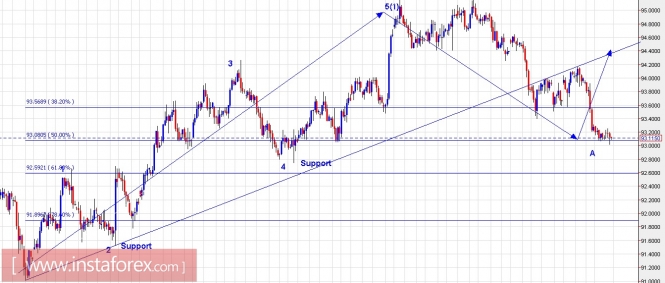
The US Dollar Index is looking to bottom out around 92.80 levels before reversing again. Please note that the index has unfolded into 5 waves impulse between 91.00 through 95.00 levels earlier, terminating into wave (1). The subsequent drop looks to be corrective in nature and is terminating into wave A or wave (2) (not labelled here). If this wave count holds to be true, then the most probable move should be on the north side. Immediate strong support is seen at 92.60/80 levels and resistance around 93.25, followed by 94.10/20 levels. Also please note that past resistance should be providing enough support for a bullish reversal around current levels.
Trading plan:
Look to remain long, stop at 91.00 and target 98.00.
Fundamental outlook:
There are no major fundamental events lined up for the day.
Good luck!
The material has been provided by InstaForex Company - www.instaforex.com