
GBP/USD opened the week with a bullish gap that was rapidly fulfilled. That move allowed the pair to consolidate above the 200 SMA at H1 chart and it's on the way to test the resistance zone of 1.2958. If it manages to break above it, then we might expect further strength towards 1.3013. MACD indicator remains in the neutral territory, favoring to a sideways scenario in the short-term.
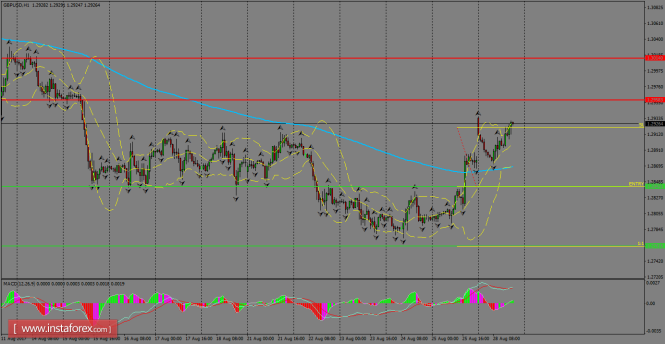
H1 chart's resistance levels: 1.2958 / 1.3013
H1 chart's support levels: 1.2842 / 1.2761
Trading recommendations for today: Based on the H1 chart, sell (short) orders only if the GBP/USD pair breaks a bearish candlestick; the support level is at 1.2842, take profit is at 1.2761 and stop loss is at 1.2921.
The material has been provided by InstaForex Company - www.instaforex.com