
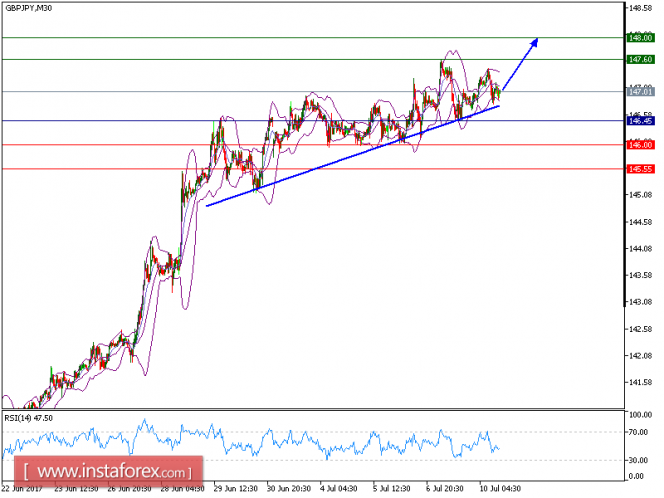
Our target which we set on 6th July has been hit and the pair is expected to follow its upside movement. The pair remains supported by both 20-period and 50-period moving averages, and is looking for a higher top. The 20-period moving average stands firmly above the 50-period moving average, and the relative strength index is also above its neutrality area at 50.
As long as 146.45 is not broken down, a further advance is preferred with 147.60 and 148.00 as targets.
Alternatively, if the price moves in the opposite direction as predicted, a short position is recommended below 146.45 with the target at 146.00.
Chart Explanation: the black line shows the pivot point. The price above pivot point indicates the bullish position and when it is below pivot points, it indicates a short position. The red lines show the support levels and the green line indicates the resistance levels. These levels can be used to enter and exit trades.
Strategy: BUY, Stop Loss: 146.00, Take Profit: 147.30.
Resistance levels: 147.60, 148.00, and 148.70
Support levels: 146.00, 145.55, and 145.00
The material has been provided by InstaForex Company - www.instaforex.com