
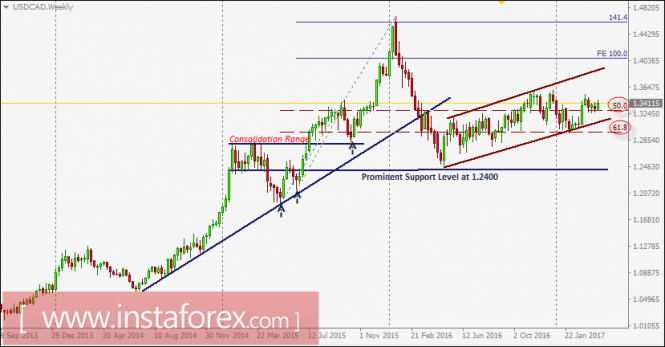
Since April 2016, the USD/CAD pair has been trending upward within the depicted ascending channel.
In December 2016, a bullish breakout above 1.3300 (50% Fibonacci level) was expected to allow a further advance toward 1.3700-1.3750 (the upper limit of the depicted channel).
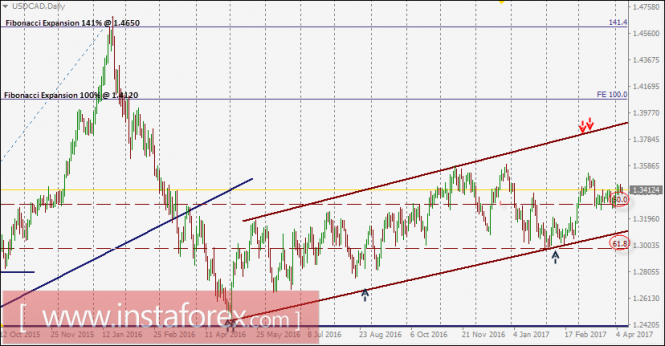
However, significant bearish rejection was expressed around 1.3580 (recently established top).
During the bearish pullback, the price level of 1.3300 (50% Fibonacci Level) failed to provide enough support to the pair.
This allowed further bearish movement toward the price level of 1.2970 (61.8% Fibonacci level) where a valid BUY entry was offered in February 2017.
Two weeks ago, the bullish breakout above 1.3300 (50% Fibonacci Level) enhanced further advance toward 1.3440 and 1.3530.
The next bullish target would be located around 1.3800 (upper limit of the depicted channel) if the pair maintains upside trading above 1.3300 (50% Fibonacci Level). That stands as a prominent support level.
On the other hand, if the USD/CAD pair moves below 1.3300, it may become trapped again within the depicted consolidation range (1.3300-1.2970).
The material has been provided by InstaForex Company - www.instaforex.com