
The Dollar index is trading sideways in a tight trading range between 100.85-100.40. The price is clearly waiting for today's NFP numbers to be announced for a new trend to start. The most probable outcome is a pullback towards 100.
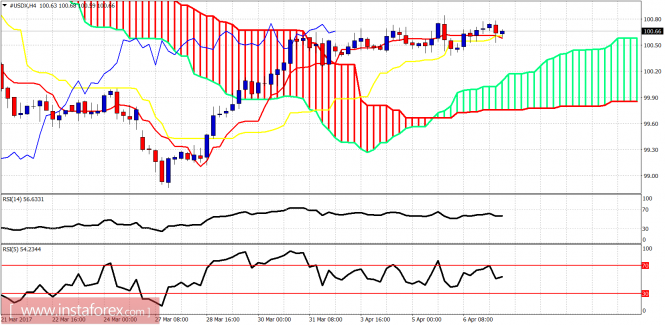
The Dollar index is trading above the Kumo (cloud) but the tenkan-sen (red line indicator) is breaking below the kijun-sen (yellow line indicator) and this is not a bullish sign. Moreover, the bearish divergence signals in the RSI in the 4-hour chart imply that there are more chances for a move lower towards cloud support near 100-100.20.
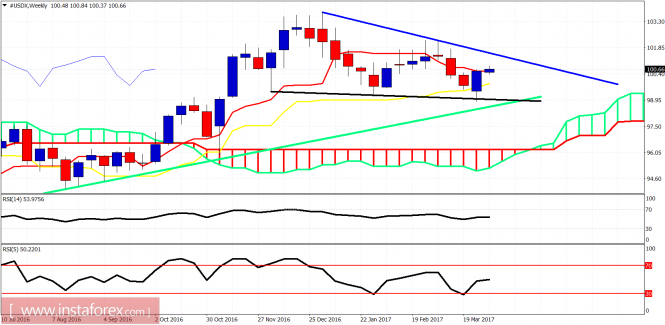 Blue line - resistance trend line
Black line - neckline support
Green line - long-term support trend line
A triangle pattern is being formed in the weekly chart of the Dollar index. Weekly resistance is at 101.50 while support is at 99. Weekly trend is bullish as the price is above the Kumo (cloud). However, the tenkan-sen (red line indicator) has a negative slope while the kijun-sen a positive slope and this could mean that we could have a bearish cross in the coming weeks. The price is trading around very important price levels that could decide medium- to long-term trend.
The material has been provided by InstaForex Company - www.instaforex.com