
Technical outlook:
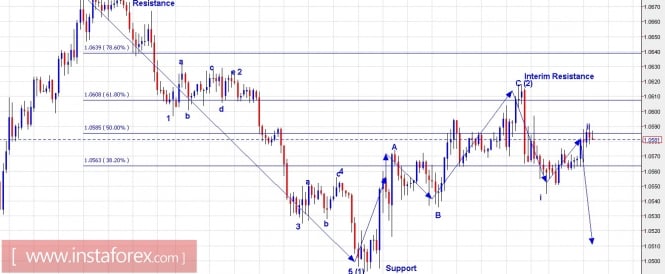
The hourly chart for EUR/USD has been depicted here for short-term wave possibilities. It looks like 1.0680 level has now become a meaningful top and the prices should ideally remain lower. The drop from 1.0680 level has also unfolded into 5 waves as an impulse (1), as shown here. Furthermore, the rally through 1.0600/15 levels has unfolded into 3 waves, corrective in nature (2), as shown here. If this wave count holds true, wave (3) has probably resumed lower from 1.0618 level and it should push the prices lower at least towards 1.0300 level. Please note that waves 1 and ii are also almost ready within 5 waves to unfold lower. Immediate resistance is seen through 1.0618 level, while support is at 1.0530/40 levels respectively. It is good to remain short and also add further on intraday rallies from here on.
Trading plan:
Please remain short now (sold from 1.0600/10), also look to add further with stop at 1.0850 and targets at 1.0300 and 1.0000.
USD/JPY chart setups:
Technical outlook:
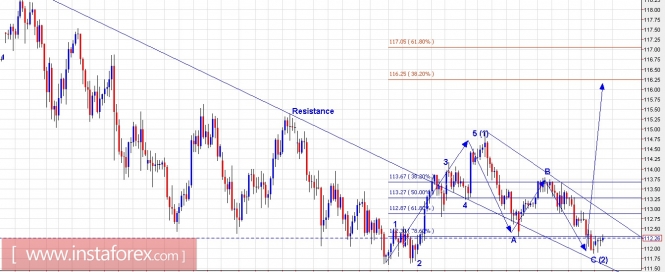
A USD/JPY 4H chart is presented here for a medium-term outlook. The pair had earlier rallied, subdividing into 5 waves from 111.60 through 114.95 level as depicted here. The corrective drop has indeed exceeded our expectations to terminate higher nonetheless it has unfolded into 3 wave, corrective in nature A-B-C also labeled as (2) above. Also please note that the pair is also testing the back side of the resistance turned support trendline. A bullish turn is highly probable from current levels and a push through 113.00 level would also break above the counter trend resistance line depicted here. The pair is also bouncing from Fibonacci 0.786 support of the entire rally between 111.60 and 114.95 levels respectively. The bullish reversal here should push the prices through 117.00 level at least.
Trading plan:
Remain long (bought from 112.80 levels), stop at 111.60 and target 117.00 levels.
Fundamental outlook:
USD is already looking to stage its final leg rally towards fresh highs across most of the currency pairs fundamentally; hence being on the long side is favored. USD Durable Goods Orders data are scheduled to come out strong at 1.9% at 08:30 AM EST, which is complementing the above views.
Good luck!
The material has been provided by InstaForex Company - www.instaforex.com