
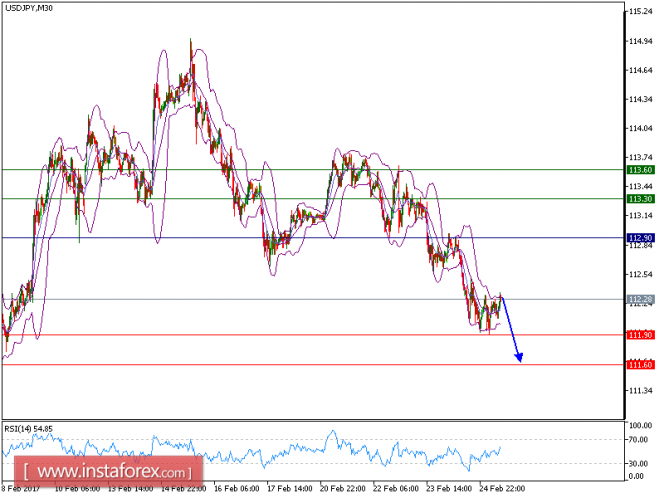
USD/JPY is under pressure, as Key resistance is at 112.90. The technical picture of the pair is bearish, as the prices are capped by a bearish trend line (since Feb 22). The downward momentum is further reinforced by the declining 50-period moving average. In addition, the upside potential should be limited by a key resistance level at 112.90.
As long as this level is not surpassed, look for a further downside to 111.90 and even 111.60 in extension.
The pair is trading below its pivot point. It is likely to trade in a lower range as long as it remains below the pivot point. Short positions are recommended with the first target at 112.55. A break below this target will move the pair further downwards to 112.30. The pivot point stands at 113.25. If the price moves in the opposite direction and bounces back from the support level, it will move above its pivot point. It is likely to move further to the upside. According to that scenario, long positions are recommended with the first target at 113.60 and the second one at 113.95.
Resistance levels: 113.60, 113.95, and 114.35
Support levels: 112.55, 112.30, and 112.00
The material has been provided by InstaForex Company - www.instaforex.com