Trading plan for 27/02/2017:
The Monday, 27th of February, looks like a slow start of the week with not many events in the economic calendar. Nevertheless, there are few news releases that will catch the investors' attention: Durable goods Orders from the US at 01:30 pm GMT, Pending Home Sales from the US at 03:00 pm GMT, Dallas Federal Reserve Manufacturing Activity Survey at 03:30 pm GMT and Robert Kaplan, Dallas FED President speech at the University of Oklahoma at 04:00 pm GMT.
EUR/USD analysis for 27/02.2017:
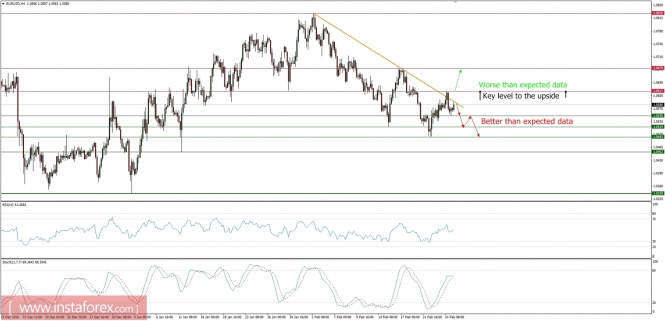
The Durable Goods Orders data are expected to increase 1.6%, after the drop of -0.4% in December 2016. The headline has been on a gentle uptrend for the past 12 months, so these stable expectations do not change the overall steady picture for the US industry. In addition to the headline news, there also will be orders data excluding transport (expected 0.5%, prior 0.5%) and core capital goods.
Let's take a look at the EUR/USD technical picture at the H4 time frame before the data is released. The bulls tried to rally higher after the golden trend line violation, but it turned out it was a fake breakout and the price has reversed. Currently, the market is still trading below the golden trendline, just in the middle of the range. The next intraday support is seen at the level of 1.0550 and the next resistance is seen at the level of 1.0617. In a case of a better than expected data the US Dollar should strengthen, so the price might break out below the support and head lower.
US Dollar Index analysis for 27/02/2017:
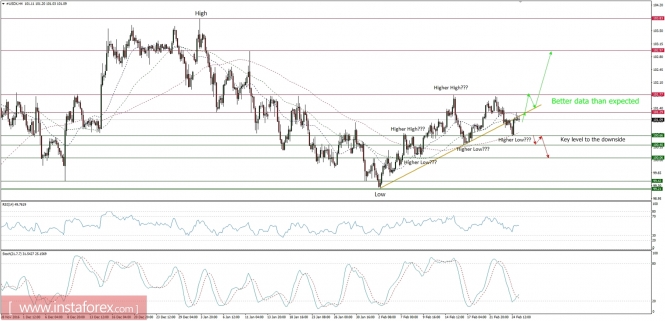
According to the January report, the demand for the houses has hit a 10-year high. That is why the market will look for today's update on pending home sales – a leading indicator for the market – for a new clue on the outlook for the rest of this quarter and beyond. The healthy uptrend is expected to continue as the market participants expect that the index will rise 1.1% in this year's first month, building on December's healthy 1.6% increase.
The US Dollar Index might benefit the most if the uptrend in home sales will continue, so let's take a look at its technical picture. The key level to the upside is the level of 101.77, but first the level of 101.29 must be clearly violated. The bulls tried to rally over the golden trendline, but they failed and now are waiting for a trigger to start the rally again. The bias is to the upside as the last sell-off did not make any new lower low, so the most important support level is at 100.66.
Gold analysis for 27/02/2017:
Since the late 2015, the Dallas Fed Manufacturing Business Index is in the uptrend, with the recent figures reported at the level of 22 points (the best result in five years). This uptrend in the factory activity is expected to grow higher and today's data should be another set of good news for the US manufacturing sector of the economy.
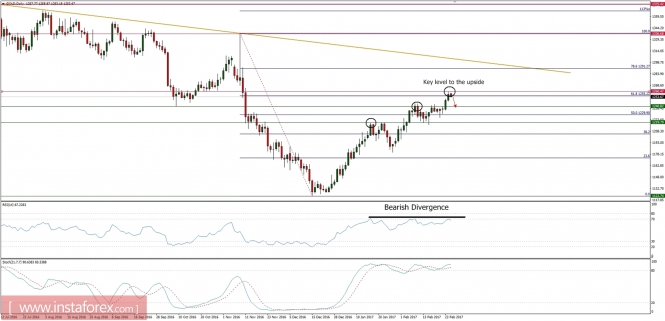
Let's take a look at the yellow metal technical picture before the news is released. At the daily time frame chart, we can see the bulls fighting with the 61%Fibo at the level of 1,255 and recently they have managed to close the daily candle above this level. Nevertheless, the overall market conditions look overbought and the growing bearish divergence suggests a corrective move to come soon. The bias is to the downside in the near term. The next support is seen at the level of 1,241 and the next resistance at the level of 1,260.
USD/JPY analysis for 27/02/2017:
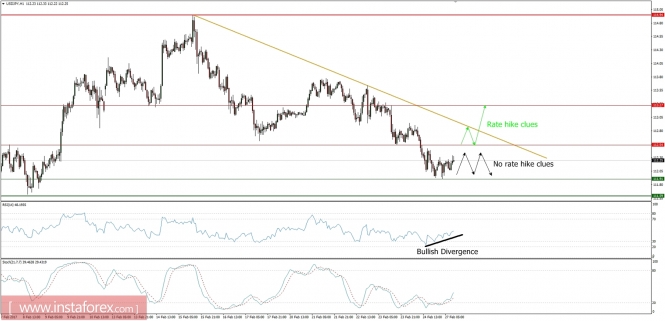
The Dallas FED President Robert Kaplan speech will be closely monitored by the market participants for any clues of a rate hike in FED meeting in March 2017. As we know from the last FED press conference, the policymakers want 2-3 interest rate hikes in 2017 and the FED Chairperson Jannet Yellen prefers them to occur rather sooner than later. Will we get any further clues regarding the exact date? We will find out soon.
The USD/JPY pair will be highly affected by any remarks in Kaplan today's speech, so let's take a look at its technical picture. At the intraday H1 time frame, the market looks oversold and the bull camp is trying to gain strength and test the next intraday resistance at the level of 112.54. For now the market is trading inside of the intraday range, but any remarks of interest rate hike in March will spark a rally towards the golden trendline resistance around the level of 113.00.