
USDX managed to end Friday's session within a small but positive tone and above the 200 SMA at H1 chart. If the index does a breakout above the key resistance zone of 101.43, further rallies to test the 102.39 level are expected to happen during this week. However, as the price action remains a little bit choppy, we could expect a narrow range to develop between the 101.43 and 100.44 levels.
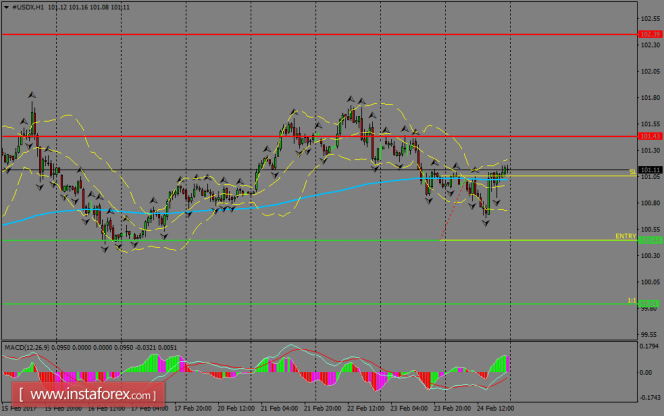
H1 chart's resistance levels: 101.43 / 102.38
H1 chart's support levels: 100.44 / 99.84
Trading recommendations for today: Based on the H1 chart, place sell (short) orders only if the USD Index breaks with a bearish candlestick; the support level is at 100.44, take profit is at 99.84 and stop loss is at 101.06.
The material has been provided by InstaForex Company - www.instaforex.com