
Bitcoin starts the new trading week with a positive rebound to the middle of the current fluctuation range. This is positive news, indicating strong support for the asset in the $55k-$60k region. At the same time, there is every reason to believe that the market correction will continue and the cryptocurrency will fall even lower before starting an upward movement to new highs.
With this in mind, it is extremely important to identify the existing corridors in the current area of price movement in order to trade the coin during the correction.
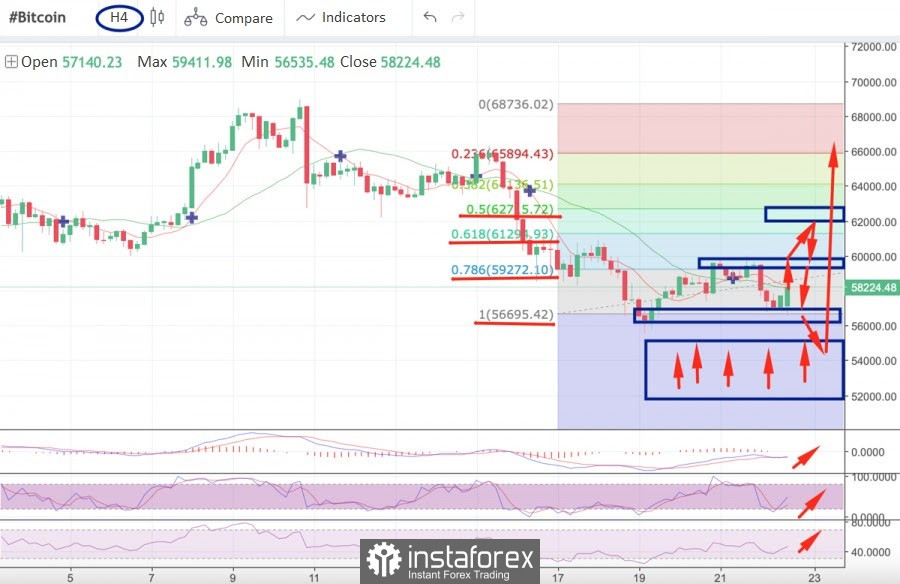
One of the most convenient tools for determining the main support and resistance levels is the Fibonacci level system, which can be drawn on any horizontal chart of a cryptocurrency and other financial instruments. The boundaries of this instrument should be defined as the beginning and end of an impulse movement (upward / downward).
The four-hour chart shows that the BTC price actively reacts to Fibo levels and moves from one line to another. The chart shows that before the rebound, the price broke through the Fibo level of 1.5, after which it began to recover and reached the $57k mark.
This suggests that the Fibo level of 1.5 is a strong support zone, and therefore, when trading here, it is worth setting take-take when playing on a decline, since, most likely, it is in this area that the price will rebound.
* Learn and analyze
Price consolidation is the period when a certain cryptocurrency is within a narrow horizontal price channel. Usually, this process indicates price stabilization or weakness of market participants (buyers and sellers).
Relative Strength Index (RSI) is a technical indicator that allows you to determine the strength of a trend (downward or upward), warns of possible changes in the direction of price movement. Thanks to this metric, it is possible to determine in what stage the asset is - overbought or underbought. The optimal mark for this chart is 60 for a bullish trend. It indicates strong demand for the coin and the strength of the current upward momentum. Upon crossing this mark, the coin begins to move towards overbought.
MACD (Moving Average Convergence / Divergence Index) is an indicator that allows you to draw certain conclusions about the trend based on the movement of moving averages and finding the metric values between them. A common bullish signal is the intersection of the white line below the red and bearish, on the contrary, when the white line crosses the red from above, which indicates a downward movement.
Stochastic (Stochastic Oscillator) indicates the strength of the momentum of the current prevailing trend. If the indicator is above 80, then the asset can be considered overbought, but if the stochastic is below 20, then this is a signal that the asset is oversold.
Fibonacci levels are a technical analysis tool used in the form of levels to which the price of an asset reacts. Used to determine price movement ranges and support/resistance zones.
As of 13:30 UTC, prerequisites for the upward movement of Bitcoin are visible, as evidenced by the growing technical indicators.
MACD and Stochastic Oscillator have formed a bullish crossover and are starting an upward movement, which indicates an attempt by buyers to consolidate their positions and push the price even higher. At the same time, the relative strength index also began to grow, confirming the increased interest of buyers in the asset.
The closest target for the price will be $59.6k. It was there that the upward impulse stopped and the price began to decline. Now, this zone is playing the role of resistance, but if it is successfully broken, a strong local support zone will form there. This is where the 50-day exponential moving average passes as well as the 0.786 Fibonacci level.
The successful breakout of the said level will move the price to the $62.5k-$63k area, where there is a strong trend resistance and the 0.5 Fibo level. Most likely, a price reversal will occur here and for some time the asset will move in a given range between two correction structures.
Next, you need to look at the market, but since BTC has not worked out the $52k- $55.5k range, the probability of a correction increases.
The nearest medium-term target for trading is below $55k, where the market should buy more before starting a full-fledged bullish rally to new highs.
In the shorter term, the main target will be the $62.5k-$63k area, where the impulse movement should reverse towards $53k.
When trading within this range and tracking price movement trends, it is necessary to pay sufficient attention to support zones as optimal levels for placing safety orders such as stop losses and take profits, since quotes tend not to break through zones on the first try.
In such cases, it is extremely important to protect yourself from unexpected bounces and the influence of news factors. However, the next week will be characterized by price movement within the $57k-$62k range and further decline beyond the $55.5k area.
The material has been provided by InstaForex Company - www.instaforex.com