
4-hour timeframe
Technical details:
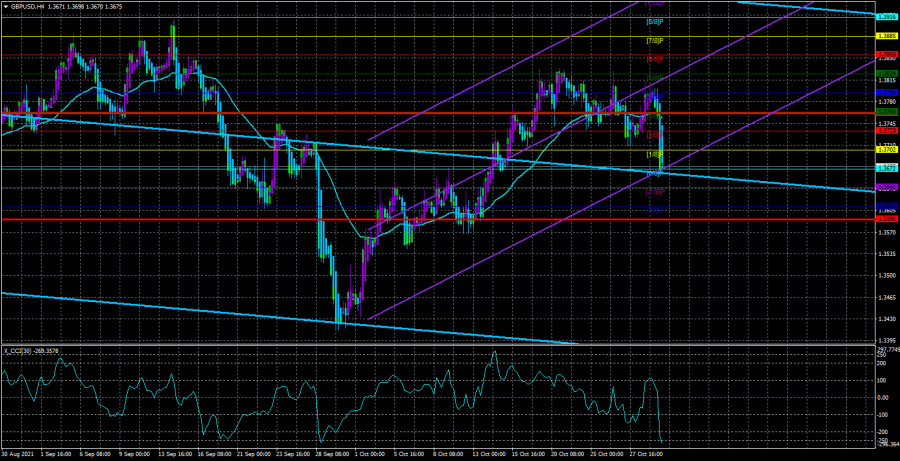
Higher linear regression channel: direction - downward.
Lower linear regression channel: direction - upward.
Moving average (20; smoothed) - downward.
The GBP/USD currency pair also collapsed on Friday, as did the EUR/USD pair. And since there were no macroeconomic statistics in the UK, we conclude that both pairs fell heavily not based on any statistics or "foundation". For the British currency, this fall even looked relatively logical, since it has been growing in recent weeks and therefore the time is ripe for a downward correction. In general, the pound continues to trade as confusing as possible. Especially if you look at the 24-hour timeframe. After the price failed to overcome the Senkou Span B line on the daily TF (which we talked about at the weekend), the chances of a resumption of the downward trend increased sharply. At the same time, there are still a few fundamental reasons for the US currency to grow. On the 4-hour timeframe of the Linear Regression Channels system, the quotes once again fell below the moving average line, so the trend has now changed to a downward one. However, it is far from a fact that a strong downward movement will now continue. Or at least the usual downward movement will continue. So far, the whole movement at the end of last week looks like an ordinary accident. It seems that traders lost their nerves, so we saw fairly high volatility. However, as follows from the illustration below, the volatility of the pound for these two days was 92 and 135 points, which is not so much for it.
The new week promises to be interesting. Especially for the pound/dollar pair.
The new week will be extremely important for the pound and the dollar. At least because it will host two meetings of central banks at once: the Fed and the Bank of England. Is it worth talking about the importance of these meetings at present? The ECB meeting last week, without any important decisions taken, provoked a strong growth of the euro. The same thing could happen this week. The trading week will start rather boring. In the UK and the States, only indices of business activity in the manufacturing sectors will be published on Monday. On Tuesday, there will not be a single macroeconomic report at all that could attract the attention of traders. But on Wednesday, the index of business activity for the services sector will be released in Britain, and the ADP report on changes in the number of employees in the private sector, the indices of business activity in the services sector according to Markit and ISM will be published in the States, and the results of the Fed meeting will be summed up in the evening. As we have already said, the key issue for the Fed will be the question of curtailing the quantitative stimulus program. And on Thursday, the results of the meeting of the Bank of England will be summed up, which also raises the issue of stimulating the economy and its completion. Recall that at the last meetings, two members of the monetary committee out of nine voted in favor of curtailing QE. If there are more of them this time, then the pound may receive tangible support.
Well, on Friday, NonFarm Payrolls, a report on unemployment and wages in the United States for October, will also be published. Thus, the last three days of the week are extremely important and volatility on these days can be very high. At the same time, it makes no sense at all to predict the possible movement of the pair for the new week. There are too many important reports and events, the outcome of which is impossible to predict. Therefore, you will have to react as information becomes available to traders. Consequently, the pair's movement this week can be almost anything. In the first two days, it will be important to understand whether the surge of emotions at the end of last week is an accident or not. And already on Wednesday, the most important data will begin to arrive, which will need to be worked out.
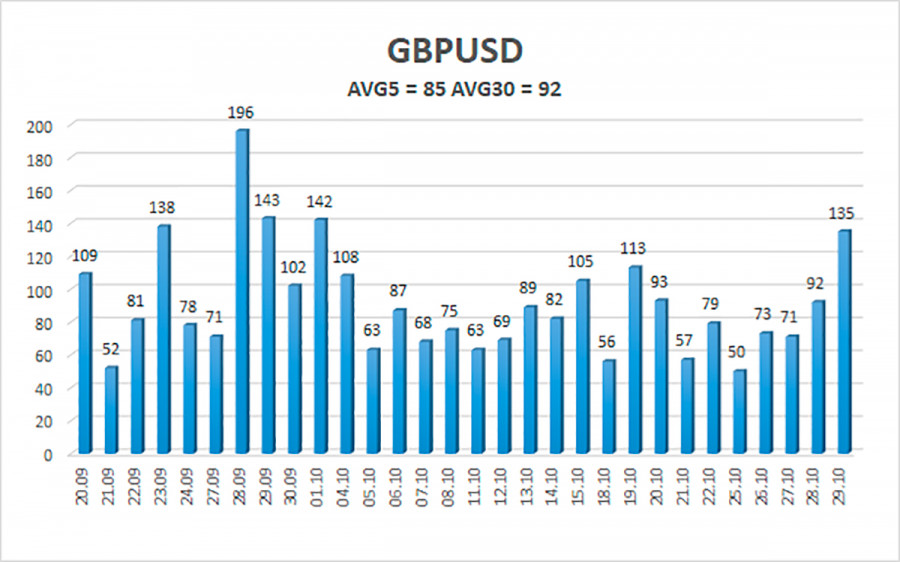
The average volatility of the GBP/USD pair is currently 85 points per day. For the pound/dollar pair, this value is "average". On Monday, November 1, we expect movement inside the channel, limited by the levels of 1.3590 and 1.3760. A reversal of the Heiken Ashi indicator upwards will signal a round of corrective movement.
Nearest support levels:
S1 – 1.3672
S2 – 1.3641
S3 – 1.3611
Nearest resistance levels:
R1 – 1.3702
R2 – 1.3733
R3 – 1.3763
Trading recommendations:
The GBP/USD pair on the 4-hour timeframe was fixed below the moving average, so the trend changed back to a downward one. Thus, at this time, it is necessary to keep open short positions with the targets of 1.3641 and 1.3611 levels until the Heiken Ashi indicator turns upwards. Buy orders can be considered again if the price is fixed above the moving average line with targets of 1.3794 and 1.3824 and keep them open until the Heiken Ashi turns down.
Explanations to the illustrations:
Linear regression channels - help determine the current trend. If both are directed in the same direction, then the trend is strong now.
Moving average line (settings 20.0, smoothed) - determines the short-term trend and the direction in which to trade now.
Murray levels - target levels for movements and corrections.
Volatility levels (red lines) - the likely price channel in which the pair will spend the next day, based on current volatility indicators.
CCI indicator - its entry into the oversold area (below -250) or into the overbought area (above +250) means that a trend reversal in the opposite direction is approaching.
The material has been provided by InstaForex Company - www.instaforex.com