
EUR/USD 5M
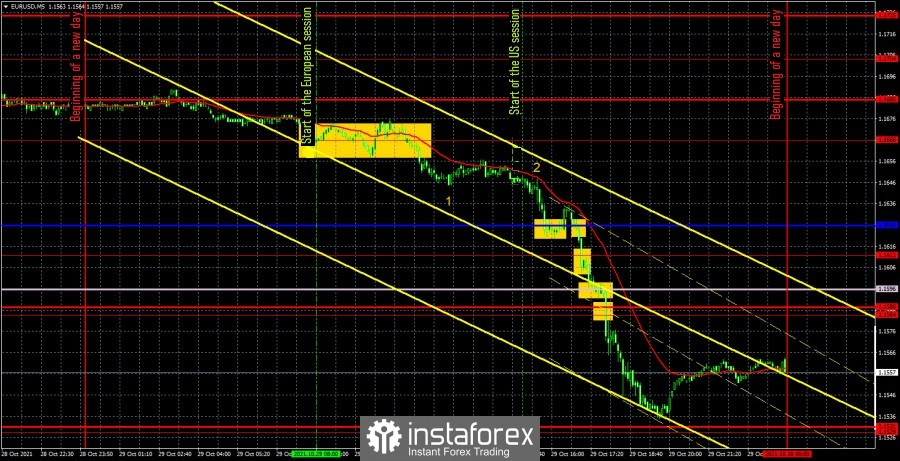
The EUR/USD pair fell by 130 points on Friday, and the total volatility of the day was 155 points. We can say with confidence that this is an absolute record of volatility over the past 3-4 months. And this "super volatile day" happened when no one expected it. It makes no sense to say that there should have been a corresponding fundamental or macroeconomic background for such volatility. It cannot be said that there were no reports at all on Friday, but nevertheless, the data on inflation and GDP in the European Union were not so shocking that the pair fell by 150 points! More precisely, they were not shocking at all for the European currency, because the GDP report turned out to be stronger than forecasts and signaled the growth of the EU economy by 2.2% in the third quarter, and inflation accelerated to 4.1% in annual terms, which is also a positive factor for the euro. One way or another, but after such reports, we should have seen a new growth in the euro, but the markets have clearly shown that buying the euro is not included in their plans. We just have to summarize what happened and analyze all trading signals. Unfortunately, Friday started with challenging signals around the 1.1666 level. The price settled several times either above this level, then below it, but here traders should have considered a flat, since there was no confident breakthrough of this level. However, it was a really difficult moment, since it was very difficult to consider a flat. However, later the price still settled below the level of 1.1666, so it was necessary to open short positions. Initially, a rebound followed from the Kijun-sen line, so the shorts should have been closed at about 20 points in profit and opened long positions. However, the buy signal turned out to be false and the longs did not bring profit to traders. The price settled below the Kijun-sen line (loss of 15 points) and traders had to short the EUR/USD pair again. This sell signal turned out to be much stronger, and the price broke through the 1.1612 level, the Senkou Span B line, the 1.1588 and 1.1584 levels and almost completed the 1.1531 level, which was not reached by only a few points. Thus, the last short position should have been manually closed at 62 points profit in the late afternoon.
EUR/USD 1H
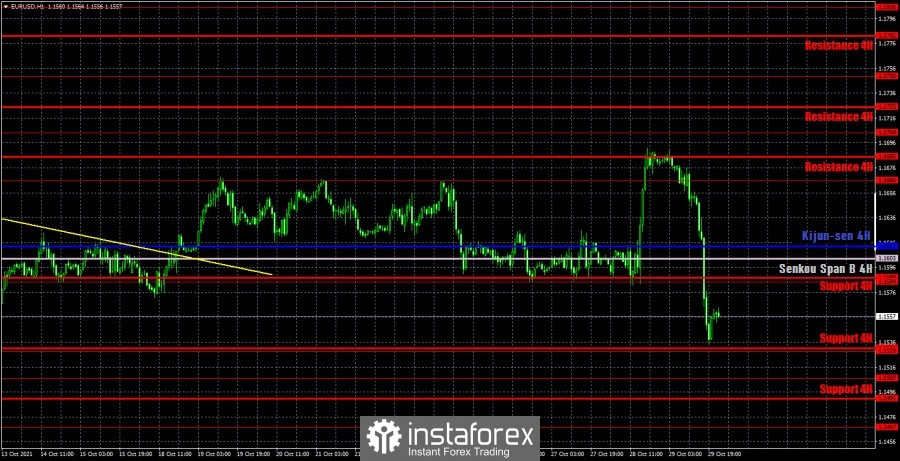
The hourly timeframe also clearly shows that the price just collapsed on Friday. Once again, we draw your attention to the fact that even taking into account European statistics, it can hardly be said that such a strong movement was justified. There is still no trend now, because after strong growth on Thursday, we saw an even stronger fall on Friday. On Monday, we highlight the following levels for trading - 1.1507, 1.1529, 1.1584, 1.1666, 1.1704, as well as the Senkou Span B (1.1603) and Kijun-sen (1.1613) lines. The Ichimoku indicator lines can change their position during the day, which should be taken into account when looking for trading signals. Signals can be rebounds or breakthroughs of these levels and lines. Do not forget about placing a Stop Loss order at breakeven if the price moves 15 points in the right direction. This will protect you against possible losses if the signal turns out to be false. No important event or publication in the European Union on November 1. Market participants will be able to turn their attention only to the index of business activity in the US manufacturing sector ISM. This is a rather important report and it can provoke a reaction of traders if its actual value differs greatly from the forecast (60.3-60.5).
We recommend you to familiarize yourself:
Overview of the EUR/USD pair. November 1. The Fed meeting can keep traders in the foreign exchange market.
Overview of the GBP/USD pair. November 1. Two meetings of central banks may end with serious movement of the pound/dollar pair.
Forecast and trading signals for GBP/USD for November 1. Detailed analysis of the movement of the pair and trade deals.
Analysis of the COT report
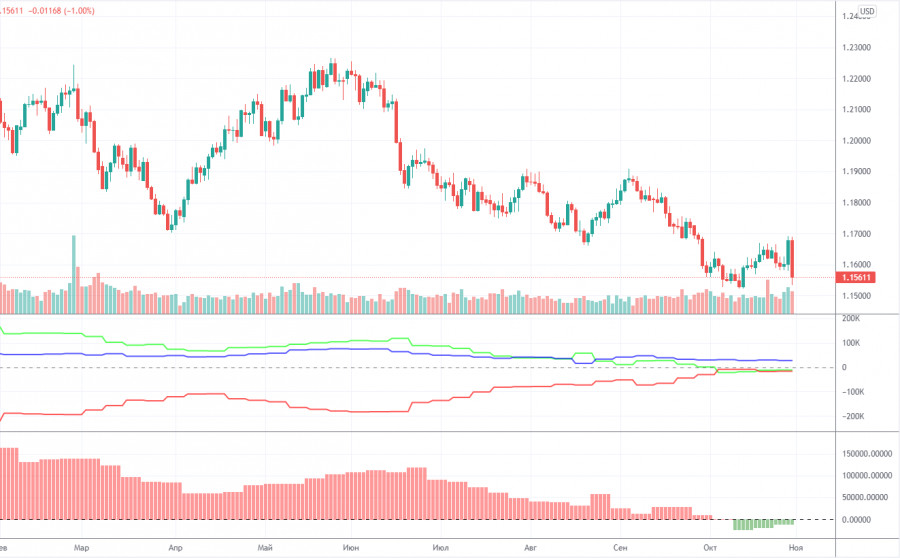
The mood of non-commercial traders practically did not change during the last reporting week (October 19-25). A group of non-commercial traders opened 4,000 sell contracts (shorts) and 4,000 buy contracts (longs). Consequently, the net position of professional players has not changed. And if so, then the mood of the large traders remained... bearish. Yes, exactly bearish, as evidenced by both indicators in the chart above. The green and red lines of the first (net positions of non-commercial and commercial players) continue to move towards each other, which still means that the upward trend is ending. Or the downward correction is delayed. Recall that the process of convergence of these lines began at the beginning of the year, when the upward movement stopped. At this time, this whole process does not even fit into a chart - the downward movement continues for so long, which we still consider to be a correction. The most interesting thing is that the last two trading days this week did not make it into the latest COT report. That is, we do not know how the major players traded on Thursday and Friday, when the pair passed about 250 points. It should also be noted that the net position of non-commercial traders remains below zero. That is, the number of short positions exceeds the total number of long positions. Consequently, based on the COT reports, the fall of the European currency may continue. The nearest target, as we have already said, is the important level of 1.1490. So far, the COT reports absolutely do not provide a conclusion about a change in trend.
Explanations for the chart:
Support and Resistance Levels are the levels that serve as targets when buying or selling the pair. You can place Take Profit near these levels.
Kijun-sen and Senkou Span B lines are lines of the Ichimoku indicator transferred to the hourly timeframe from the 4-hour one.
Support and resistance areas are areas from which the price has repeatedly rebounded off.
Yellow lines are trend lines, trend channels and any other technical patterns.
Indicator 1 on the COT charts is the size of the net position of each category of traders.
Indicator 2 on the COT charts is the size of the net position for the non-commercial group.
The material has been provided by InstaForex Company - www.instaforex.com