
EUR/USD 5M
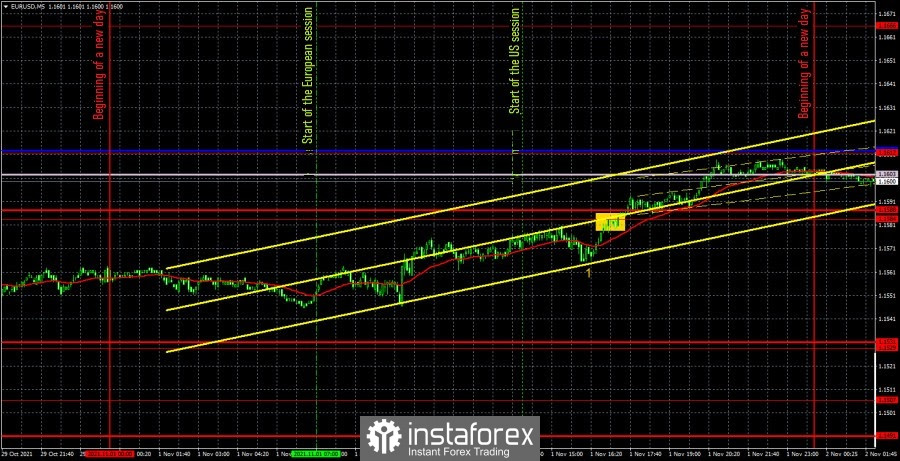
The EUR/USD pair showed volatility of about 50 points during the first trading day of the week. That's how much the pair goes through in most cases in the last 3-4 months. After the pair first rose by 100 points at the end of last week, and then collapsed by 150, there were hopes for a recovery in volatility. But the very first day of the new week showed that the events of Thursday and Friday could have been just an accident. The only macroeconomic report on Monday to pay attention to was the ISM business activity index for the manufacturing sector in the United States. It amounted to 60.8 at the end of October, which is 0.4 points more than the forecast. However, as we can see in the chart above, after its publication (the figure "1" in the chart), the strengthening of the dollar just stopped. Thus, it can be concluded that it was ignored. Which is not at all surprising after the markets ignored reports on European inflation and GDP at the end of last week. Therefore, much more important fundamental factors matter now, and not ordinary reports. There were few trading signals on Monday. Or rather one. And even then it was formed in the late afternoon – the price overcame the extreme level of 1.1584. Theoretically, it could have been worked out, but it did not allow you to earn a large amount, since the price hardly went up a few points. It should have been closed manually until the transaction got into a loss. Thus, the day ended with zero profit, since the price did not even approach any of the important levels or lines in the European trading session.
EUR/USD 1H
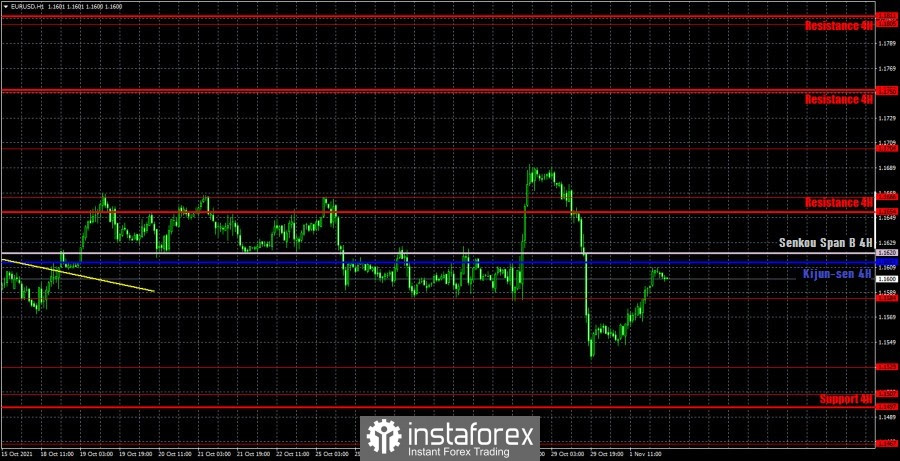
The hourly timeframe also clearly shows that the euro/dollar pair was recovering on Monday against Friday's fall. Interestingly, Friday's move was originally a recovery from Thursday's rally. It would be ridiculous if the pair takes a course to the level of 1.1700 from the current positions. Then it will definitely not be possible to tie the latest movements to the foundation or macroeconomics. Needless to say, there is no trend now, and the current movement is generally very difficult to describe in one word? We highlight the following levels for trading on Tuesday - 1.1507, 1.1529, 1.1584, 1.1666, 1.1704, as well as the Senkou Span B (1.1620) and Kijun-sen (1.1613) lines. The Ichimoku indicator lines can change their position during the day, which should be taken into account when looking for trading signals. Signals can be rebounds or breakthroughs of these levels and lines. Do not forget about placing a Stop Loss order at breakeven if the price moves 15 points in the right direction. This will protect you against possible losses if the signal turns out to be false. Only the index of business activity in the manufacturing sector will be published in the European Union on November 2, and nothing at all in the United States. If the markets ignored the much more important statistics from the eurozone on Friday, then the chances of working out this far from the most important indicator are even less. We can assume that the macroeconomic background will be absent today, and volatility may remain low.
We recommend you to familiarize yourself:
Overview of the EUR/USD pair. November 2. A surprise may await us on Wednesday. Not from the Fed, but from the markets themselves.
Overview of the GBP/USD pair. November 2. A new conflict erupts between Britain and France.
Forecast and trading signals for GBP/USD for November 2. Detailed analysis of the movement of the pair and trade deals.
Analysis of the COT report
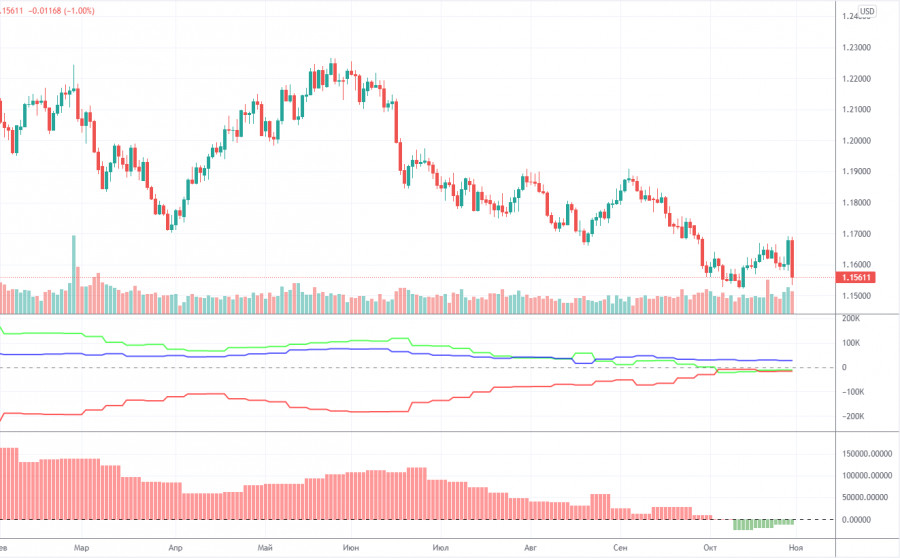
The mood of non-commercial traders practically did not change during the last reporting week (October 19-25). A group of non-commercial traders opened 4,000 sell contracts (shorts) and 4,000 buy contracts (longs). Consequently, the net position of professional players has not changed. And if so, then the mood of the large traders remained... bearish. Yes, exactly bearish, as evidenced by both indicators in the chart above. The green and red lines of the first (net positions of non-commercial and commercial players) continue to move towards each other, which still means that the upward trend is ending. Or the downward correction is delayed. Recall that the process of convergence of these lines began at the beginning of the year, when the upward movement stopped. At this time, this whole process does not even fit into a chart - the downward movement continues for so long, which we still consider to be a correction. The most interesting thing is that the last two trading days this week did not make it into the latest COT report. That is, we do not know how the major players traded on Thursday and Friday, when the pair passed about 250 points. It should also be noted that the net position of non-commercial traders remains below zero. That is, the number of short positions exceeds the total number of long positions. Consequently, based on the COT reports, the fall of the European currency may continue. The nearest target, as we have already said, is the important level of 1.1490. So far, the COT reports absolutely do not provide a conclusion about a change in trend.
Explanations for the chart:
Support and Resistance Levels are the levels that serve as targets when buying or selling the pair. You can place Take Profit near these levels.
Kijun-sen and Senkou Span B lines are lines of the Ichimoku indicator transferred to the hourly timeframe from the 4-hour one.
Support and resistance areas are areas from which the price has repeatedly rebounded off.
Yellow lines are trend lines, trend channels and any other technical patterns.
Indicator 1 on the COT charts is the size of the net position of each category of traders.
Indicator 2 on the COT charts is the size of the net position for the non-commercial group.
The material has been provided by InstaForex Company - www.instaforex.com