
Wave analysis
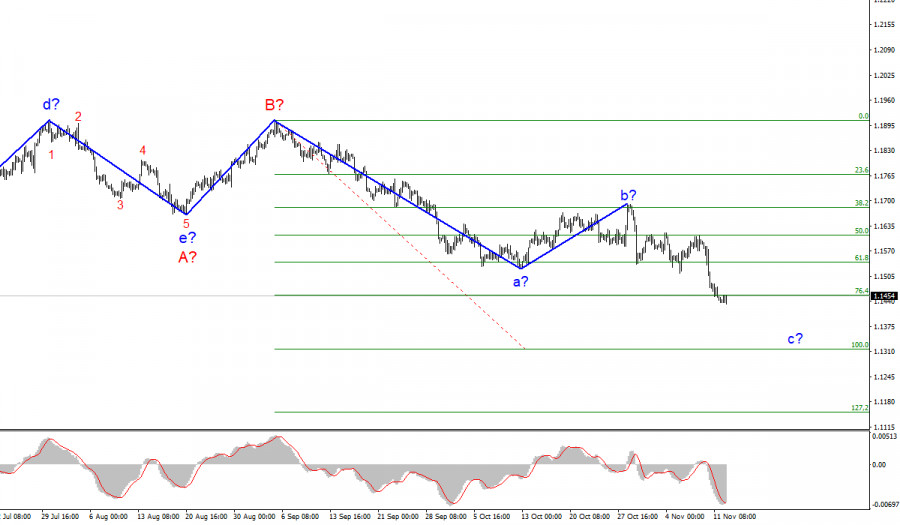
The wave layout for the EUR/USD pair on the H4 chart looks quite complete at the moment. The a-b-c-d-e trend section that was formed at the very beginning of the year should be interpreted as a wave A, while further rise of the pair should be seen as a wave B. Therefore, wave C is being formed at the moment and it could take a rather extended form. Its internal corrective wave b has become more complicated than I expected. Yet, the subsequent decline of the quotes which can be regarded as the wave c in C keeps the entire wave layout complete. The assumed wave c is likely to be no less extended than the wave a. Its targets are located below the area of 15 all the way to the level of 13. For the wave to continue its formation, the price needs to break through the level of 1.1455 which correlates with the 76.4% Fibonacci retracement level. The whole C wave can also take a shorter form but this scenario is a secondary one.
Slow market on Friday
The fundamental background for the EUR/USD pair was quite weak on Friday. Just one important report on US inflation for October was released this week, and it was the only market catalyst. On Wednesday, the euro quotes moved by 116 basis points. On Monday, the quotes passed 19 pips, then 10 pips on Tuesday, 30 pips on Thursday, and 0 on Friday. The fluctuation range for today amounted to 15 basis points. Therefore, I can conclude without even looking at the economic calendar that no major changes happened today. However , this is not quite true. It seems that the market has simply downplayed today's news. Thus, today, the EU published a report on industrial production which showed a decline of 0.2% in September on a monthly basis. At the same time, industrial production expanded by 5.2% year-on-year. The demand for the euro could have slightly increased as markets had expected a weaker result. Just a few hours ago, a minor report on the Michigan Consumer Sentiment Index was published in the US. As a rule, markets do not show any reaction to this data. However, in August, the reading suddenly dropped from 81.2 to 70.3 points, thus dragging down the US dollar. Today , however, the index declined by just 5 points. So, the only reaction to this news was a sluggish sell-off of the greenback which eventually declined by 25 pips. This move came to an end rather quickly, and the pair missed some 5-10 pips to reach its yearly low.
Conclusion
Based on the analysis above, I can conclude that the descending wave C will continue to form further, while its internal wave b has already completed its formation. Therefore, I would recommend selling the pair following each sell signal of the MACD indicator. The targets can be found at the level of 1.1314 which corresponds with the 100.0% Fibonacci level.
Higher time frame
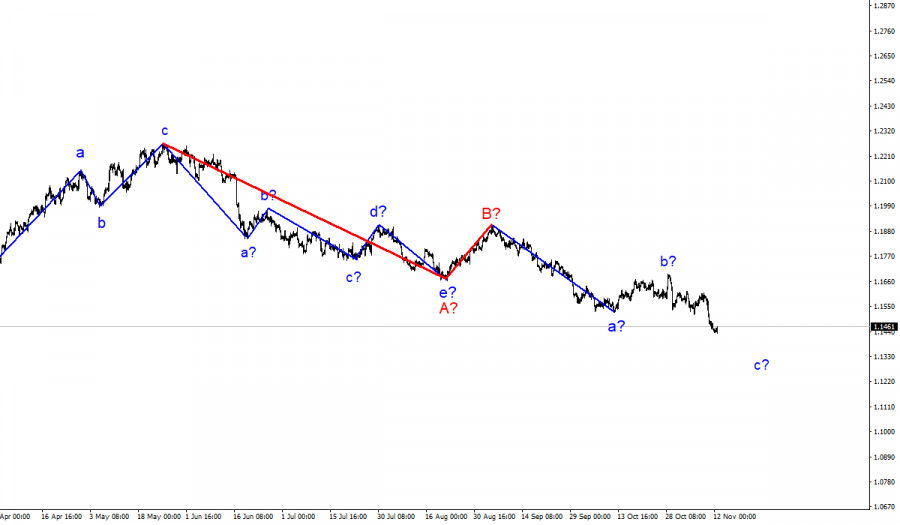
The wave layout on the higher time frame looks quite convincing. The quotes continue to move lower. The descending section of the trend that was initiated on May 25 takes the form of a three-wave correctional pattern A-B-C. This means that the downtrend may continue for another month or two until the wave C is fully completed.
The material has been provided by InstaForex Company - www.instaforex.com