
4-hour timeframe
Technical details:
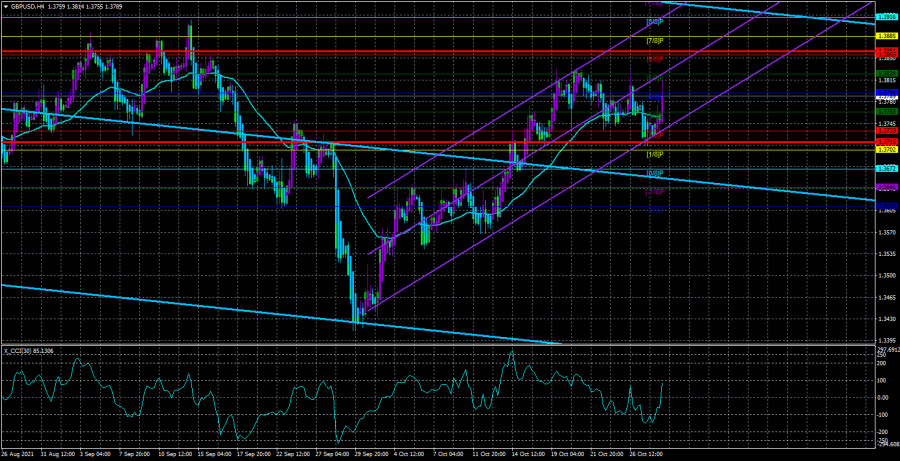
Higher linear regression channel: direction - downward.
Lower linear regression channel: direction - upward.
Moving average (20; smoothed) - sideways.
The GBP/USD currency pair was more or less active on Thursday, which traders were frankly waiting for. We have already drawn traders' attention to volatility indicators many times. Now is the time to do it again. The illustration below clearly shows how much the indicators have fallen even in the context of the last month and a half. Yesterday, volatility finally rose slightly, thereby giving hope for its growth in the future. Meanwhile, an important GDP report for the third quarter was published in the States, which could not but disappoint traders. Instead of the expected growth of 2.6% q/q, the markets saw an increase of only 2.0%. Thus, with a slight delay, market participants began to sell the US currency, which led to the consolidation of the pair above the moving average line. It should be noted that, as in the case of the euro/dollar pair, the bears failed to develop their success after consolidating below the moving average. Thus, the upward movement may resume at this time. However, we also draw attention to the fact that yesterday a strong drop in the dollar was provoked by a strong report (and in the European Union - also by the results of the ECB meeting). It may be an isolated case, after which everything will return to its place. In any case, time will tell. Already today, it may become clear whether yesterday's strong movement of both pairs was an accident or whether the markets finally began to trade more actively.
A complete set of problems for the UK.
Recall that the UK is once again facing problems. We have already written about the "fuel crisis", which is part of the "logistics". We also wrote that negotiations on the "Northern Ireland protocol" with the European Union are at an impasse. In addition, the whole country is gripped by a shortage of some goods, and the British are in panic buying up all the goods for the future. Also, we must not forget about the rather difficult situation with the "coronavirus". Currently, the UK is in second place in the world in terms of infection rates. Over the past 28 days, more than 1 million people have been infected and 3.5 thousand have died. And this is in a country where the entire adult population has received both vaccinations against COVID. As you can see, vaccines are not working very well yet, and the British economy may face a new batch of problems.
It is also impossible not to note the fact that people are fleeing from the UK now, as from a sinking ship. Of course, this does not apply to the British themselves. However, recent opinion polls have shown that more than half of the country's population is not happy with how Brexit is proceeding. The European Union is already saying publicly that the UK is facing an economic catastrophe because of Brexit, and the country's government is still trying to disguise the consequences of Brexit under the consequences of the coronavirus pandemic. And now whole countries are fleeing from the Kingdom. Scotland intends to hold an independence referendum next year. Separatist sentiments are maturing in Wales. Earlier, according to opinion polls, it became known that many Northern Irishmen do not see themselves as part of the Kingdom in 10 years. Thus, even if none of these countries leaves the Kingdom, such sentiments perfectly reflect where people live better: in Britain or the European Union. In any case, these are new problems for the British government that will need to be solved somehow. And the more such problems there are, the more likely it is that Boris Johnson will not be the next prime minister, and the Conservatives will not rule in Parliament. Thus, the pound continues to be located quite high. However, in the future, it may resume its depreciation against the dollar for several years.
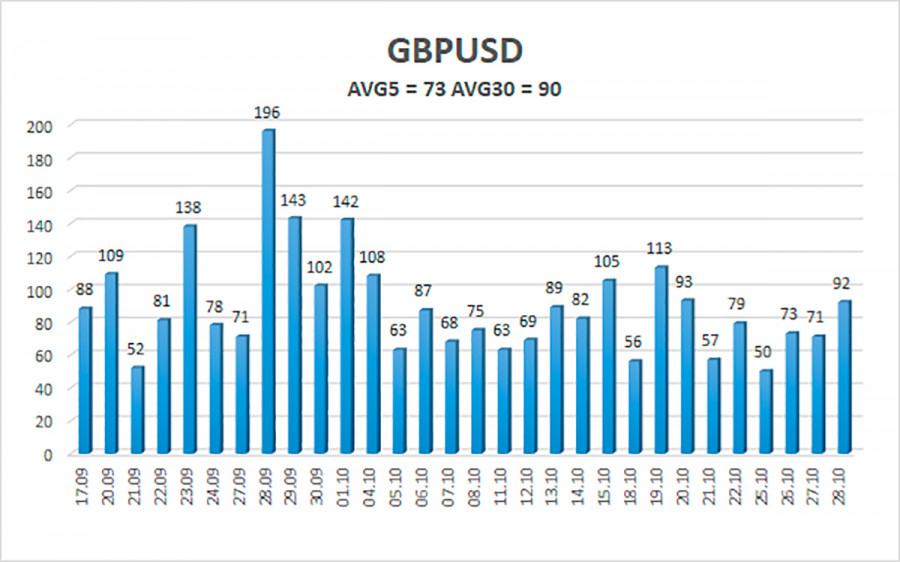
The average volatility of the GBP/USD pair is currently 73 points per day. For the pound/dollar pair, this value is "average". On Friday, October 29, we expect movement inside the channel, limited by the levels of 1.3715 and 1.3861. The reversal of the Heiken Ashi indicator downwards signals a round of corrective movement.
Nearest support levels:
S1 – 1.3763
S2 – 1.3733
S3 – 1.3702
Nearest resistance levels:
R1 – 1.3794
R2 – 1.3824
R3 – 1.3855
Trading recommendations:
The GBP/USD pair on the 4-hour timeframe was fixed above the moving average, so the trend changed back to an upward one. Thus, at this time, it is necessary to keep open long positions with targets of 1.3824 and 1.3855 levels until the Heiken Ashi indicator turns down. Sell orders can be considered again if the price is fixed below the moving average line with targets of 1.3733 and 1.3715 and keep them open until the Heiken Ashi turns up.
Explanations to the illustrations:
Linear regression channels - help determine the current trend. If both are directed in the same direction, then the trend is strong now.
The moving average line (settings 20.0, smoothed) - determines the short-term trend and the direction in which trading should be conducted now.
Murray levels - target levels for movements and corrections.
Volatility levels (red lines) - the likely price channel in which the pair will spend the next day, based on current volatility indicators.
CCI indicator - its entry into the oversold area (below -250) or into the overbought area (above +250) means that a trend reversal in the opposite direction is approaching.
The material has been provided by InstaForex Company - www.instaforex.com