
Yesterday, the pair unexpectedly worked out the low (35 points) on the news, but then the trend took its toll, and the daily candle closed with a white candle, remaining below the historical resistance level of 1.2234 (blue dotted line). Today, the price may continue to move up. As per the economic calendar, news is not expected on Tuesday.
Trend analysis (Fig. 1).
On Tuesday, the market from the level of 1.2215 (closing of yesterday's daily candle), in the morning will try to continue the upward movement with the target of 1.2277, which is the retracement level of 85.4% (yellow dotted line). Upon testing this level, the price may continue to move up with the target of 1.2348 - the upper limit of the indicator Bollinger bands (dotted black line).
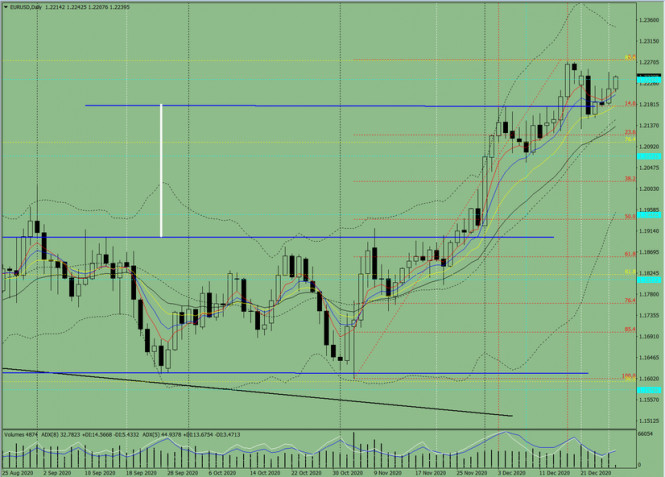
Figure 1 (Daily Chart).
Comprehensive analysis:
- Indicator analysis - up;
- Fibonacci levels - up;
- Volumes - up;
- Candlestick analysis - up;
- Trend analysis - up;
- Bollinger bands - up;
- Weekly chart - up.
General conclusion:
Today, the price from the level of 1.2215 (closing of yesterday's daily candle), in the morning will try to continue the upward movement with the target of 1.2277, which is the retracement level of 85.4% (yellow dotted line). Upon testing this level, the price may continue to move up with the target of 1.2348 - the upper limit of the indicator Bollinger bands (dotted black line).
Unlikely scenario: When moving upward, after reaching the pullback level of 85.4% - 1.2277 (yellow dotted line), a downward movement is possible with the target of 1.2117 - a pullback level of 14.6% (red dotted line).
The material has been provided by InstaForex Company - www.instaforex.com